Join us at FabCon Vienna from September 15-18, 2025
The ultimate Fabric, Power BI, SQL, and AI community-led learning event. Save €200 with code FABCOMM.
Get registered- Power BI forums
- Get Help with Power BI
- Desktop
- Service
- Report Server
- Power Query
- Mobile Apps
- Developer
- DAX Commands and Tips
- Custom Visuals Development Discussion
- Health and Life Sciences
- Power BI Spanish forums
- Translated Spanish Desktop
- Training and Consulting
- Instructor Led Training
- Dashboard in a Day for Women, by Women
- Galleries
- Data Stories Gallery
- Themes Gallery
- Contests Gallery
- Quick Measures Gallery
- Notebook Gallery
- Translytical Task Flow Gallery
- TMDL Gallery
- R Script Showcase
- Webinars and Video Gallery
- Ideas
- Custom Visuals Ideas (read-only)
- Issues
- Issues
- Events
- Upcoming Events
Enhance your career with this limited time 50% discount on Fabric and Power BI exams. Ends August 31st. Request your voucher.
- Power BI forums
- Forums
- Get Help with Power BI
- Desktop
- X-axis not displaying what values I chose
- Subscribe to RSS Feed
- Mark Topic as New
- Mark Topic as Read
- Float this Topic for Current User
- Bookmark
- Subscribe
- Printer Friendly Page
- Mark as New
- Bookmark
- Subscribe
- Mute
- Subscribe to RSS Feed
- Permalink
- Report Inappropriate Content
X-axis not displaying what values I chose
Good afternoon,
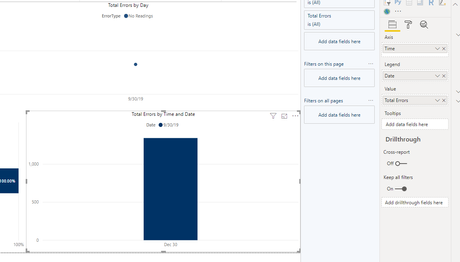
I have a visualization that is supposed to show errors by time of day. When my data model has more data and more instances of errors, the visualization populates as I would like it to, but with few errors and data points, the visualization changes.
I would like the X-Axis to show Time over a 24 hour period. Such as the image below:
But what I end up with is this:
Now, I don’t mind if it only had ONE time, say 12:00:00 AM, but this is giving me the date on the X-axis that isn’t even correct. I looked at the data model, made sure all of my columns had the correct format. My time column has a Time Only format but still shows the auto date of 12/30/1899. Any tips on how to get this to display the time and NOT the date in the X-axis?
- Mark as New
- Bookmark
- Subscribe
- Mute
- Subscribe to RSS Feed
- Permalink
- Report Inappropriate Content
@Amomin1988 change data type of your column to time, or make new column by duplicating this column adn change its' data type to time. I believe your current data type for your column is data/time not time
Subscribe to the @PowerBIHowTo YT channel for an upcoming video on List and Record functions in Power Query!!
Learn Power BI and Fabric - subscribe to our YT channel - Click here: @PowerBIHowTo
If my solution proved useful, I'd be delighted to receive Kudos. When you put effort into asking a question, it's equally thoughtful to acknowledge and give Kudos to the individual who helped you solve the problem. It's a small gesture that shows appreciation and encouragement! ❤
Did I answer your question? Mark my post as a solution. Proud to be a Super User! Appreciate your Kudos 🙂
Feel free to email me with any of your BI needs.
- Mark as New
- Bookmark
- Subscribe
- Mute
- Subscribe to RSS Feed
- Permalink
- Report Inappropriate Content
@parry2k I definitely have the column formatted as time
With that formatting everything looks fine in the query editor:
But then, I apply and save, go to the modelling part in the data view and see this:
I think that auto time that gets added is my problem and I don't know how to get rid of it.
Helpful resources
| User | Count |
|---|---|
| 79 | |
| 78 | |
| 37 | |
| 33 | |
| 31 |
| User | Count |
|---|---|
| 93 | |
| 81 | |
| 59 | |
| 49 | |
| 48 |


