FabCon is coming to Atlanta
Join us at FabCon Atlanta from March 16 - 20, 2026, for the ultimate Fabric, Power BI, AI and SQL community-led event. Save $200 with code FABCOMM.
Register now!- Power BI forums
- Get Help with Power BI
- Desktop
- Service
- Report Server
- Power Query
- Mobile Apps
- Developer
- DAX Commands and Tips
- Custom Visuals Development Discussion
- Health and Life Sciences
- Power BI Spanish forums
- Translated Spanish Desktop
- Training and Consulting
- Instructor Led Training
- Dashboard in a Day for Women, by Women
- Galleries
- Data Stories Gallery
- Themes Gallery
- Contests Gallery
- QuickViz Gallery
- Quick Measures Gallery
- Visual Calculations Gallery
- Notebook Gallery
- Translytical Task Flow Gallery
- TMDL Gallery
- R Script Showcase
- Webinars and Video Gallery
- Ideas
- Custom Visuals Ideas (read-only)
- Issues
- Issues
- Events
- Upcoming Events
Get Fabric Certified for FREE during Fabric Data Days. Don't miss your chance! Request now
- Power BI forums
- Forums
- Get Help with Power BI
- Desktop
- Wrong calculation of course attendance when showin...
- Subscribe to RSS Feed
- Mark Topic as New
- Mark Topic as Read
- Float this Topic for Current User
- Bookmark
- Subscribe
- Printer Friendly Page
- Mark as New
- Bookmark
- Subscribe
- Mute
- Subscribe to RSS Feed
- Permalink
- Report Inappropriate Content
Wrong calculation of course attendance when showing the range of Financial Years
Hi,
First of all, when I select each FY, the course attendance is correctly reflected but when I select the whole FYs from FY13 to FY21, the course attendance shown in the combo chart is not correct.
You can see the two combo charts:
If I select FY21, the course attendance will be 12% but when I select the whole range of FYs from FY13 to FY21, the course attenance is 8%. I understand why I make a mistake and it got something to do with the wrong DAX calculation.
I have set up a simple DAX formula to calculate the course attendance:
Course attendance = ([Total no of program attendees]/[Total no of employees])
Total no of program attendees refers to the no of program attendees attended any programs in that particular FY
Total no of employees refers to the no of employees in that particular FY.
So, when I select FY21, total no of program attendees is 60 while the total no of employees for that FY21 is 500, so the course attendance will be 60/500 (for example) is 12%.
But when I select the all FYs, the total no of program attendees remains 60 but the total no of employees (FY13 to FY21 meaning employees are employed or resign from the firm) became 750 for example so the course attendance will be 8%. In this case, it is wrong and it should reflect 12% for FY21 even if I select the whole range of FYs. I need to change the DAX formula so that once I select the whole range of FYs, the course attendance for particular FY should be correctly reflected.
Thanks
- Mark as New
- Bookmark
- Subscribe
- Mute
- Subscribe to RSS Feed
- Permalink
- Report Inappropriate Content
Hi @Anonymous ,
Would you please inform us more detailed information( your
sample pbix (by OneDrive for Business)) if possible? Then we will help you more correctly.
Please do mask sensitive data before uploading.
Thanks for your understanding and support.
Best Regards,
Dedmon Dai
- Mark as New
- Bookmark
- Subscribe
- Mute
- Subscribe to RSS Feed
- Permalink
- Report Inappropriate Content
@Anonymous , DISTINCTCOUNT can only differ in view bys, Not here(same view/group) . Can change this visual to table and have this column added and check is it really changing with filter. I doubt I can help much with a sample data.
Can you share sample data and sample output in table format? Or a sample pbix after removing sensitive data.
- Mark as New
- Bookmark
- Subscribe
- Mute
- Subscribe to RSS Feed
- Permalink
- Report Inappropriate Content
@Anonymous , Share the formula of
Total no of employees
Can you share sample data and sample output in table format? Or a sample pbix after removing sensitive data.
- Mark as New
- Bookmark
- Subscribe
- Mute
- Subscribe to RSS Feed
- Permalink
- Report Inappropriate Content
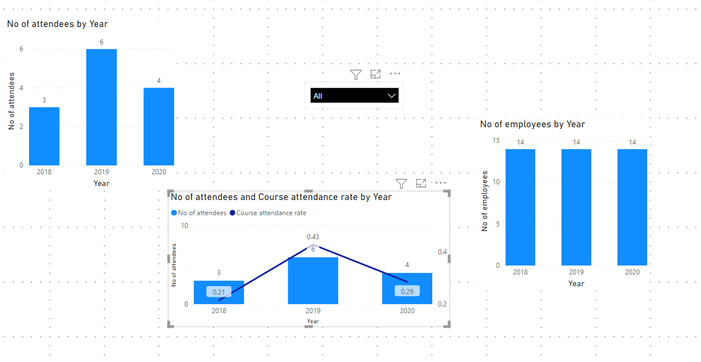
Thanks. I have added in the sample data for your information. As for the table "No of employees", I don't understand why I keep on getting wrong value of total no of employees per year. This table is the replica of the actual table but my original table shows the correct value of no of employees. Perhaps you can take a look at it.
By the way how do I share the pbx with you? I could not find any insert icon for me to attach pbi workbook.
Employee table
Attendee table
Attendance rate
Results
You can see that the results for the total no of employees are not correct.
- Mark as New
- Bookmark
- Subscribe
- Mute
- Subscribe to RSS Feed
- Permalink
- Report Inappropriate Content
- Mark as New
- Bookmark
- Subscribe
- Mute
- Subscribe to RSS Feed
- Permalink
- Report Inappropriate Content
Hi I have already attached the sample data for your request. Pls let me know if you need any clarification.
THanks
Helpful resources

Power BI Monthly Update - November 2025
Check out the November 2025 Power BI update to learn about new features.

Fabric Data Days
Advance your Data & AI career with 50 days of live learning, contests, hands-on challenges, study groups & certifications and more!

| User | Count |
|---|---|
| 104 | |
| 81 | |
| 66 | |
| 50 | |
| 45 |


