FabCon is coming to Atlanta
Join us at FabCon Atlanta from March 16 - 20, 2026, for the ultimate Fabric, Power BI, AI and SQL community-led event. Save $200 with code FABCOMM.
Register now!- Power BI forums
- Get Help with Power BI
- Desktop
- Service
- Report Server
- Power Query
- Mobile Apps
- Developer
- DAX Commands and Tips
- Custom Visuals Development Discussion
- Health and Life Sciences
- Power BI Spanish forums
- Translated Spanish Desktop
- Training and Consulting
- Instructor Led Training
- Dashboard in a Day for Women, by Women
- Galleries
- Data Stories Gallery
- Themes Gallery
- Contests Gallery
- QuickViz Gallery
- Quick Measures Gallery
- Visual Calculations Gallery
- Notebook Gallery
- Translytical Task Flow Gallery
- TMDL Gallery
- R Script Showcase
- Webinars and Video Gallery
- Ideas
- Custom Visuals Ideas (read-only)
- Issues
- Issues
- Events
- Upcoming Events
The Power BI Data Visualization World Championships is back! Get ahead of the game and start preparing now! Learn more
- Power BI forums
- Forums
- Get Help with Power BI
- Desktop
- What-If Parameter
- Subscribe to RSS Feed
- Mark Topic as New
- Mark Topic as Read
- Float this Topic for Current User
- Bookmark
- Subscribe
- Printer Friendly Page
- Mark as New
- Bookmark
- Subscribe
- Mute
- Subscribe to RSS Feed
- Permalink
- Report Inappropriate Content
What-If Parameter
Hi
I have inherited a PBi dashboard which is a bit of a monster, But for this question, I have put together some mock data and visuals.
Scenario:
Users show which activities they have been doing as well as, how many hours spent on each activity, which pay centre the hours will be placed against, and if the hours benefit either the client or the company they work for.
Visuals
I have two Matrix tables and a card.
Table 1 shows the users and a breakdown of the hours they have worked and to who the hours benefit.
Table 2 shows a breakdown of the activities categories that have been booked and benefit the company along with the total hours booked to each category by all employees.
Card Percentage of all of the hours that benefit the company.
Requirements
I need to be able to show how the figures would change if the number of hours spent on the, 'IT' activity or the 'Communication' activities, were changed to the contract and not to company. I would also then need to revert back to the current figures.
I believe that a What-If Parameter is required but I am unsure how to create a measure that would affect only one 'Booking Activity' at a time.
Can this be done?
Any help would be greatly appreciated.
Plump
Solved! Go to Solution.
- Mark as New
- Bookmark
- Subscribe
- Mute
- Subscribe to RSS Feed
- Permalink
- Report Inappropriate Content
Hi @Plump_Lil_Monk ,
Try following logic:
1. Create your What-If parameter in Model section:
2. Create a new measure. Measure should work only for IT and Communication, for the rest the hours will not change. You can try something like this:
FYI - this measure works also with Parameter Value, which is value connected to your What If table and slicer. Combining Parameter Value with Hours will solve your problem.
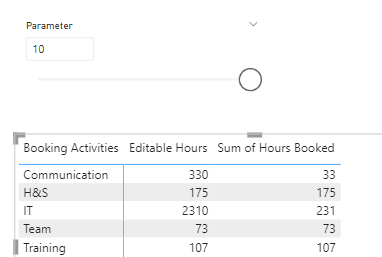
I Have an example in my own matrix.
As you can see, slicer has value = 10, so my hours in IT and Communication are 10x bigger. Other values are the same:

If my answer was helpful please give me a Kudos or even accept as a Solution.
Let's connect on LinkedIn!
- Mark as New
- Bookmark
- Subscribe
- Mute
- Subscribe to RSS Feed
- Permalink
- Report Inappropriate Content
@Migasuke Thanks for your reply, much appreciated.
Apologies, I should have been more precise with my requirement, but I will take your example and expand.
I need to be able to show that if IT and Comms booking activity is increased by a certain amount to contract (let's say 10), how would that affect the overall percentage displayed in the % card?
Thanks
Thanks
- Mark as New
- Bookmark
- Subscribe
- Mute
- Subscribe to RSS Feed
- Permalink
- Report Inappropriate Content
Hi @Plump_Lil_Monk ,
Try following logic:
1. Create your What-If parameter in Model section:
2. Create a new measure. Measure should work only for IT and Communication, for the rest the hours will not change. You can try something like this:
FYI - this measure works also with Parameter Value, which is value connected to your What If table and slicer. Combining Parameter Value with Hours will solve your problem.
I Have an example in my own matrix.
As you can see, slicer has value = 10, so my hours in IT and Communication are 10x bigger. Other values are the same:

If my answer was helpful please give me a Kudos or even accept as a Solution.
Let's connect on LinkedIn!
Helpful resources

Power BI Dataviz World Championships
The Power BI Data Visualization World Championships is back! Get ahead of the game and start preparing now!

| User | Count |
|---|---|
| 41 | |
| 38 | |
| 36 | |
| 30 | |
| 28 |
| User | Count |
|---|---|
| 128 | |
| 88 | |
| 79 | |
| 67 | |
| 62 |


