FabCon is coming to Atlanta
Join us at FabCon Atlanta from March 16 - 20, 2026, for the ultimate Fabric, Power BI, AI and SQL community-led event. Save $200 with code FABCOMM.
Register now!- Power BI forums
- Get Help with Power BI
- Desktop
- Service
- Report Server
- Power Query
- Mobile Apps
- Developer
- DAX Commands and Tips
- Custom Visuals Development Discussion
- Health and Life Sciences
- Power BI Spanish forums
- Translated Spanish Desktop
- Training and Consulting
- Instructor Led Training
- Dashboard in a Day for Women, by Women
- Galleries
- Data Stories Gallery
- Themes Gallery
- Contests Gallery
- QuickViz Gallery
- Quick Measures Gallery
- Visual Calculations Gallery
- Notebook Gallery
- Translytical Task Flow Gallery
- TMDL Gallery
- R Script Showcase
- Webinars and Video Gallery
- Ideas
- Custom Visuals Ideas (read-only)
- Issues
- Issues
- Events
- Upcoming Events
The Power BI Data Visualization World Championships is back! Get ahead of the game and start preparing now! Learn more
- Power BI forums
- Forums
- Get Help with Power BI
- Desktop
- Visual filter breaking drill-through
- Subscribe to RSS Feed
- Mark Topic as New
- Mark Topic as Read
- Float this Topic for Current User
- Bookmark
- Subscribe
- Printer Friendly Page
- Mark as New
- Bookmark
- Subscribe
- Mute
- Subscribe to RSS Feed
- Permalink
- Report Inappropriate Content
Visual filter breaking drill-through
I've got a drill-through page that isn't working when a particular visual filter is added and I don't know why.
A simplified dataset where I've recreated the problem is here.
Data
- The IDs of customers are listed on a Customer table.
- Different marketing communications are on the Appeals table with an Appeal Code, grouped by a Campaign Code.
- The Communications table records the sending of marketing to a customer. Again, the Appeal Code and Campaign Code are included.
- Financial transactions are in the Transactions table, again with Appeal Code and Campaign Code.
Here's the data model:
Purpose of report
- While the Transaction table records an Appeal Code, they may have been due to marketing sent out with a different appeal code.
- I'm using a concept of attribution where I want to get the value of all Transactions where a Customer has received a Communication for a particular campaign.
Here's the DAX definition of the Attribution Transaction Value. It isn't actually relevant to the problem, but will help make sense of the visuals:
Attribution Transaction Value = CALCULATE ( [Transaction Value],
                                CROSSFILTER('Communications'[Customer ID], 'Customers'[Customer ID], Both),
                                CROSSFILTER('Appeals'[Appeal Code], 'Transactions'[Appeal Code], None))
Drill-through
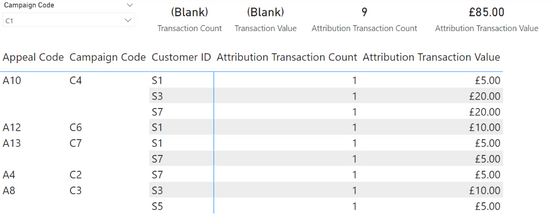
I have a table showing the attributed counts and ultimately I want a tooltip to show the Appeal Code of the Communication that the Customer received. However, when I had problems I used a drill-through to give a bit more visibility to what's going on.
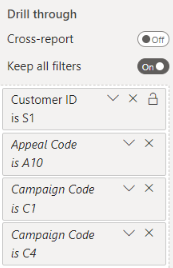
I've got a drill-through page with Customer ID as the filter and Keep all filters checked. The drill through page has the Appeal Code and Campaign Code from the Communication Table. I want the Customers[Customer ID] field in the table above and the Appeals[Campaign Code] from the slicer at the top of the page to filter the Communication table to show only the Appeal that the Customer received communication for.
I can get this working without any visual level filter. I get the following table when I drill through, which is what I want to see.
The filters shown are here:
Note - the Appeal Code = A10 and Campaign Code = C4 are on the Transaction table, so don't filter the Communication table.
Visual filter breaking drill-through
I have a further measure that counts rows on the Communication table:
Communication Count = COUNTROWS ('Communications')
Now when I filter my table to when Communication Count > 0 the drill-through returns no values:

This seems to be from the extra filter added due to the visual level filter:

The full text is Appeal Code, Campaign Code, Customer ID from visual. When I remove this filter the drill-through works again. Even more confusing, when I set this table up to filter from the same page I get the behaviour I want regardless of the visual filter:

Questions
- Why does this visual filter break the drill-through?
- What does that bottom filter added in the drill-through represent?
- Why does the drill-through filter differently from the visual interaction?
- Mark as New
- Bookmark
- Subscribe
- Mute
- Subscribe to RSS Feed
- Permalink
- Report Inappropriate Content
When I ran the internal SUMMARIZECOLUMNS from the filter,
SUMMARIZECOLUMNS(
'Transactions'[Appeal Code],
'Transactions'[Campaign Code],
'Customers'[Customer ID],
__SQDS0FilterTable,
"Communication_Count", IGNORE('Measure Table'[Communication Count]),
"CountRowsTransactions", CALCULATE(COUNTROWS('Transactions'))
)
I got an empty table back. There don't appear to be any transactions which match campaign C1
- Mark as New
- Bookmark
- Subscribe
- Mute
- Subscribe to RSS Feed
- Permalink
- Report Inappropriate Content
If you use Performance Analyzer to get the query generated for the visual on the drillthrough page and then look at that in DAX Studio you can see that the Appeals[Campaign Code] from the slicer on the main page is being used as a filter, and this results in an empty table. This is being triggered when you add the measure as a filter.
You could disable the keep all filters option and then add the fields which you do want to be kept as filters and I think that should clear the problem
- Mark as New
- Bookmark
- Subscribe
- Mute
- Subscribe to RSS Feed
- Permalink
- Report Inappropriate Content
I wanted the Appeals[Campaign Code] to be brought through as a filter, so drilling through from the first line of the table filters to Customer S1 (from the table) and Campaign C1 (from the slicer) which does bring a result. Is that not correct?
Good call on using DAX Studio, the section highlighted in red below is what changes when the visual filter is added. Might take a while to pick through exactly what's happening here - any ideas?
DEFINE
VAR __DS0FilterTable =
TREATAS({"S1"}, 'Customers'[Customer ID])

VAR __DS0FilterTable2 =
TREATAS({"C1"}, 'Appeals'[Campaign Code])

VAR __DS0FilterTable3 =
TREATAS({"A10"}, 'Transactions'[Appeal Code])

VAR __DS0FilterTable4 =
TREATAS({"C4"}, 'Transactions'[Campaign Code])

VAR __SQDS0FilterTable =
TREATAS({"C1"}, 'Appeals'[Campaign Code])

VAR __SQDS0Core =
FILTER(
KEEPFILTERS(
SELECTCOLUMNS(
KEEPFILTERS(
FILTER(
KEEPFILTERS(
SUMMARIZECOLUMNS(
'Transactions'[Appeal Code],
'Transactions'[Campaign Code],
'Customers'[Customer ID],
__SQDS0FilterTable,
"Communication_Count", IGNORE('Measure Table'[Communication Count]),
"CountRowsTransactions", CALCULATE(COUNTROWS('Transactions'))
)
),
OR(
OR(
NOT(ISBLANK('Transactions'[Appeal Code])),
NOT(ISBLANK('Transactions'[Campaign Code]))
),
NOT(ISBLANK('Customers'[Customer ID]))
)
)
),
"'Transactions'[Appeal Code]", 'Transactions'[Appeal Code],
"'Transactions'[Campaign Code]", 'Transactions'[Campaign Code],
"'Customers'[Customer ID]", 'Customers'[Customer ID],
"Communication_Count", [Communication_Count]
)
),
[Communication_Count] > 0
)

VAR __DS0Core =
CALCULATETABLE(
SUMMARIZE('Communications', 'Communications'[Appeal Code], 'Communications'[Campaign Code]),
KEEPFILTERS(__DS0FilterTable),
KEEPFILTERS(__DS0FilterTable2),
KEEPFILTERS(__DS0FilterTable3),
KEEPFILTERS(__DS0FilterTable4),
KEEPFILTERS(__SQDS0Core)
)

VAR __DS0PrimaryWindowed =
TOPN(501, __DS0Core, 'Communications'[Appeal Code], 1, 'Communications'[Campaign Code], 1)

EVALUATE
__DS0PrimaryWindowed

ORDER BY
'Communications'[Appeal Code], 'Communications'[Campaign Code]
Helpful resources

Power BI Dataviz World Championships
The Power BI Data Visualization World Championships is back! Get ahead of the game and start preparing now!

| User | Count |
|---|---|
| 37 | |
| 36 | |
| 33 | |
| 31 | |
| 29 |
| User | Count |
|---|---|
| 132 | |
| 86 | |
| 85 | |
| 68 | |
| 64 |


