FabCon is coming to Atlanta
Join us at FabCon Atlanta from March 16 - 20, 2026, for the ultimate Fabric, Power BI, AI and SQL community-led event. Save $200 with code FABCOMM.
Register now!- Power BI forums
- Get Help with Power BI
- Desktop
- Service
- Report Server
- Power Query
- Mobile Apps
- Developer
- DAX Commands and Tips
- Custom Visuals Development Discussion
- Health and Life Sciences
- Power BI Spanish forums
- Translated Spanish Desktop
- Training and Consulting
- Instructor Led Training
- Dashboard in a Day for Women, by Women
- Galleries
- Data Stories Gallery
- Themes Gallery
- Contests Gallery
- QuickViz Gallery
- Quick Measures Gallery
- Visual Calculations Gallery
- Notebook Gallery
- Translytical Task Flow Gallery
- TMDL Gallery
- R Script Showcase
- Webinars and Video Gallery
- Ideas
- Custom Visuals Ideas (read-only)
- Issues
- Issues
- Events
- Upcoming Events
Get Fabric Certified for FREE during Fabric Data Days. Don't miss your chance! Request now
- Power BI forums
- Forums
- Get Help with Power BI
- Desktop
- Using a Visuals data as slicer
- Subscribe to RSS Feed
- Mark Topic as New
- Mark Topic as Read
- Float this Topic for Current User
- Bookmark
- Subscribe
- Printer Friendly Page
- Mark as New
- Bookmark
- Subscribe
- Mute
- Subscribe to RSS Feed
- Permalink
- Report Inappropriate Content
Using a Visuals data as slicer
Hi there,
I'm trying to figure out how I can use the output on visual as a splicer.
Below you will see different names (user id). The graphs already has a relation so it filters all the users accoring to a certian reason, when clicking on one of the bards.
Then I use the filter fuction by using TopN on the desktop option, get the top 10 users effected by the reaons.
However, not that I have the top 10 names affected by the reason I want to use the top 10 names to use as a slicer so I can drill down into each of the top 10 users individually.
Any ideas? Maybe missing a best practice?
Thanks
- Mark as New
- Bookmark
- Subscribe
- Mute
- Subscribe to RSS Feed
- Permalink
- Report Inappropriate Content
@niel_orvyn1
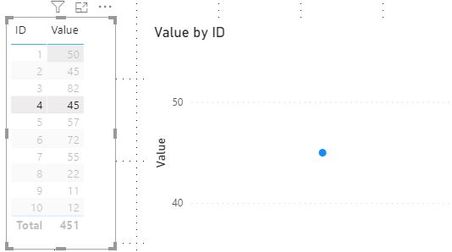
As far as I know, you can not make the table visual works as a slicer to filter a bar chart.
As an alternative, you may use a line chart instead, when select a role on the table visual the line graph will be filtered and drill down to the selected category only.
Paul Zheng _ Community Support Team
If this post helps, then please consider Accept it as the solution to help the other members find it more quickly.
- Mark as New
- Bookmark
- Subscribe
- Mute
- Subscribe to RSS Feed
- Permalink
- Report Inappropriate Content
Hi @Anonymous - thanks for the below. Yes I figured that you cannot make the table visual work as a filter after many hours😀. But thanks for the below, I will give it a go in future.
I managed to complete my report by using the button (ctrl+click) to next page after selection data (a bar) and this was good enough for now.
Many thanks for you time in giving the suggetion.
Best Regards
- Mark as New
- Bookmark
- Subscribe
- Mute
- Subscribe to RSS Feed
- Permalink
- Report Inappropriate Content
@niel_orvyn1 , Rank should help you .
For Rank Refer these links
https://radacad.com/how-to-use-rankx-in-dax-part-2-of-3-calculated-measures
https://radacad.com/how-to-use-rankx-in-dax-part-1-of-3-calculated-columns
https://radacad.com/how-to-use-rankx-in-dax-part-3-of-3-the-finale
https://community.powerbi.com/t5/Community-Blog/Dynamic-TopN-made-easy-with-What-If-Parameter/ba-p/3...
- Mark as New
- Bookmark
- Subscribe
- Mute
- Subscribe to RSS Feed
- Permalink
- Report Inappropriate Content
Many thanks for the links, it was very usefull and very well presented (very clear), and helped a great deal on my learning curve.
However, I could not use it as my solution, I ended up using the drill through option with buttons.
Best regards,
Niel
Helpful resources

Power BI Monthly Update - November 2025
Check out the November 2025 Power BI update to learn about new features.

Fabric Data Days
Advance your Data & AI career with 50 days of live learning, contests, hands-on challenges, study groups & certifications and more!


