Join us at the 2025 Microsoft Fabric Community Conference
Microsoft Fabric Community Conference 2025, March 31 - April 2, Las Vegas, Nevada. Use code FABINSIDER for a $400 discount.
Register now- Power BI forums
- Get Help with Power BI
- Desktop
- Service
- Report Server
- Power Query
- Mobile Apps
- Developer
- DAX Commands and Tips
- Custom Visuals Development Discussion
- Health and Life Sciences
- Power BI Spanish forums
- Translated Spanish Desktop
- Training and Consulting
- Instructor Led Training
- Dashboard in a Day for Women, by Women
- Galleries
- Webinars and Video Gallery
- Data Stories Gallery
- Themes Gallery
- Power BI DataViz World Championships Gallery
- Quick Measures Gallery
- R Script Showcase
- COVID-19 Data Stories Gallery
- Community Connections & How-To Videos
- 2021 MSBizAppsSummit Gallery
- 2020 MSBizAppsSummit Gallery
- 2019 MSBizAppsSummit Gallery
- Events
- Ideas
- Custom Visuals Ideas
- Issues
- Issues
- Events
- Upcoming Events
The Power BI DataViz World Championships are on! With four chances to enter, you could win a spot in the LIVE Grand Finale in Las Vegas. Show off your skills.
- Power BI forums
- Forums
- Get Help with Power BI
- Desktop
- Unique Products Top 3 Sales Months
- Subscribe to RSS Feed
- Mark Topic as New
- Mark Topic as Read
- Float this Topic for Current User
- Bookmark
- Subscribe
- Printer Friendly Page
- Mark as New
- Bookmark
- Subscribe
- Mute
- Subscribe to RSS Feed
- Permalink
- Report Inappropriate Content
Unique Products Top 3 Sales Months
Hi
In Power BI, can you write a measure that could display a unique product's top 3 selling months over a time span?
Ideally I would like to show each product's top selling months.
Example data
| Product | Jan | Feb | Mar | Apr | May | Jun | Jul | Aug | Sep | Oct | Nov | Dec |
| A | 20 | 52 | 14 | 14 | 45 | 34 | 64 | 52 | 29 | 61 | 41 | 87 |
| B | 55 | 60 | 15 | 78 | 20 | 33 | 58 | 12 | 64 | 92 | 82 | 47 |
| C | 44 | 55 | 18 | 16 | 20 | 36 | 37 | 43 | 64 | 59 | 25 | 54 |
| D | 10 | 54 | 16 | 24 | 35 | 40 | 64 | 17 | 91 | 72 | 82 | 37 |
So for example, Product A results should be Dec at 87, Jul at 64, and Oct at 61.
I could do this fairly easily in excel using conditional formatting top/bottom rules. Trying to translate this to BI
THanks!
Solved! Go to Solution.
- Mark as New
- Bookmark
- Subscribe
- Mute
- Subscribe to RSS Feed
- Permalink
- Report Inappropriate Content
Hi IamTDR ,
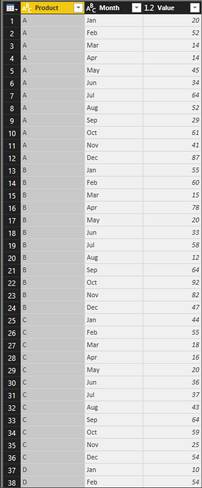
To achieve your requirement, click Query Editor-> Transform-> Cilck on columns [Jan] ~ [Dec]-> Click "Unpivot Columns".

After apply&closed, create a calculate column using DAX formula as below:
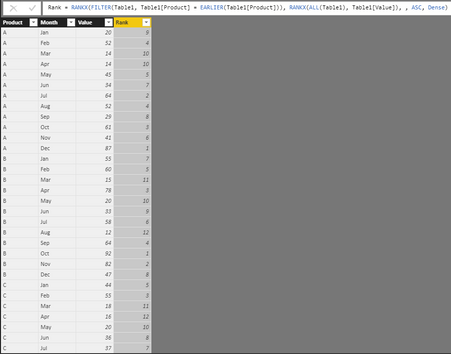
Rank = RANKX(FILTER(Table1, Table1[Product] = EARLIER(Table1[Product])), RANKX(ALL(Table1), Table1[Value]), , ASC, Dense)

Finally, create a matrix chart and a slicer chart based on Rank column, set range 1~3 in the slicer chart, you will see what you expected.

Regards,
Jimmy Tao
- Mark as New
- Bookmark
- Subscribe
- Mute
- Subscribe to RSS Feed
- Permalink
- Report Inappropriate Content
Hi IamTDR ,
To achieve your requirement, click Query Editor-> Transform-> Cilck on columns [Jan] ~ [Dec]-> Click "Unpivot Columns".

After apply&closed, create a calculate column using DAX formula as below:
Rank = RANKX(FILTER(Table1, Table1[Product] = EARLIER(Table1[Product])), RANKX(ALL(Table1), Table1[Value]), , ASC, Dense)

Finally, create a matrix chart and a slicer chart based on Rank column, set range 1~3 in the slicer chart, you will see what you expected.

Regards,
Jimmy Tao
- Mark as New
- Bookmark
- Subscribe
- Mute
- Subscribe to RSS Feed
- Permalink
- Report Inappropriate Content
Hi @IamTDR
Pivot the data in Query Editor and then you can use the TOP N/ Bottom N filter in visual filter.
Thanks
Raj
- Mark as New
- Bookmark
- Subscribe
- Mute
- Subscribe to RSS Feed
- Permalink
- Report Inappropriate Content
Thanks for the quick reply.
This method would provide top sales overall though correct? I am interested in keep each unique product and then being Power BI show me the top sales months over a few years of data.
Helpful resources

Join us at the Microsoft Fabric Community Conference
March 31 - April 2, 2025, in Las Vegas, Nevada. Use code MSCUST for a $150 discount!

Power BI Monthly Update - February 2025
Check out the February 2025 Power BI update to learn about new features.

Join our Community Sticker Challenge 2025
If you love stickers, then you will definitely want to check out our Community Sticker Challenge!

| User | Count |
|---|---|
| 84 | |
| 69 | |
| 68 | |
| 39 | |
| 37 |
