FabCon is coming to Atlanta
Join us at FabCon Atlanta from March 16 - 20, 2026, for the ultimate Fabric, Power BI, AI and SQL community-led event. Save $200 with code FABCOMM.
Register now!- Power BI forums
- Get Help with Power BI
- Desktop
- Service
- Report Server
- Power Query
- Mobile Apps
- Developer
- DAX Commands and Tips
- Custom Visuals Development Discussion
- Health and Life Sciences
- Power BI Spanish forums
- Translated Spanish Desktop
- Training and Consulting
- Instructor Led Training
- Dashboard in a Day for Women, by Women
- Galleries
- Data Stories Gallery
- Themes Gallery
- Contests Gallery
- Quick Measures Gallery
- Notebook Gallery
- Translytical Task Flow Gallery
- TMDL Gallery
- R Script Showcase
- Webinars and Video Gallery
- Ideas
- Custom Visuals Ideas (read-only)
- Issues
- Issues
- Events
- Upcoming Events
Join the Fabric FabCon Global Hackathon—running virtually through Nov 3. Open to all skill levels. $10,000 in prizes! Register now.
- Power BI forums
- Forums
- Get Help with Power BI
- Desktop
- Unable to use numeric column from SSAS Tabular Mod...
- Subscribe to RSS Feed
- Mark Topic as New
- Mark Topic as Read
- Float this Topic for Current User
- Bookmark
- Subscribe
- Printer Friendly Page
- Mark as New
- Bookmark
- Subscribe
- Mute
- Subscribe to RSS Feed
- Permalink
- Report Inappropriate Content
Unable to use numeric column from SSAS Tabular Model as value
Hi there,
I have a SSAS tabular model (compatibility level SQL Server 2019 / Azure Analysis Services (1500)) and this model is deployed to SSAS server (version 15.0.35.19). The data is retrieve from MS SQL Server.
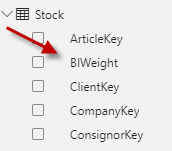
When connecting to this model using Live Connect from Power BI (Version: 2.100.1381.0 64-bit ) I can import the model. Whitin the model all the columns of the numeric type can't be used as a value to present in a graph or do calculations with.
There is no sigma sign in front of the column name,
but the properties in the model look like :
so by default this column should be able to at least summerize.
The data is retrieve from MS SQL Server database via views. When looking at this view, the column is numeric :
What did I mis ??
Thanks in advance.
Jacco
Solved! Go to Solution.
- Mark as New
- Bookmark
- Subscribe
- Mute
- Subscribe to RSS Feed
- Permalink
- Report Inappropriate Content
@jacccodezwart probably someone created a Calculation Group on this model.
This will force the mode property 'Discourage Implicit Measure' to True
And you will not be able to use implicit aggregations rather explicitly create measures on top of the columns (which is anyway the best practice)
You can undo this change by changing this model propery but only if you first delete all the calculation groups (in case you don't need them).
- Mark as New
- Bookmark
- Subscribe
- Mute
- Subscribe to RSS Feed
- Permalink
- Report Inappropriate Content
SpartaBI, super thanks !!!!
Took a while to find the property, but after switching to code and search for the property, turn it to false, deploy the model, everything works !!!!
I know that using measures on top of columns is the best practice, but during development of the model I like to experiment using the columns direct.
Thanks again !!
Jacco
- Mark as New
- Bookmark
- Subscribe
- Mute
- Subscribe to RSS Feed
- Permalink
- Report Inappropriate Content
@jacccodezwart my pleasure 🙂
Check out my showcase report - got some high level stuff there. Sure you will find there a lot of cool ideas and give it a thumbs up over there if you liked it 🙂
https://community.powerbi.com/t5/Data-Stories-Gallery/SpartaBI-Feat-Contoso-100K/td-p/2449543


