cancel
Showing results for 
Search instead for 
Did you mean: 

July 7 - July 17 | Round 2 of the Power BI Dataviz World Championships. Don't miss your chance! Learn more

Reply
Anonymous
Not applicable

Tree Map

Hello

I'm completely begginer and english is not my native language. I'll try my best to explain.

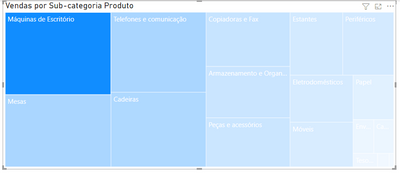
I was testing a tree map with gradient colors according to sum of sales. The thing is when I click in one of the segments I put on group, the others fade away and even typing Esc it doesn't get back to normal. Is that normal with tree maps? 

The other graphs I tried I just type esc and it gets back to original form.

Here is how it looks after I click in one of the segments and it remais like that after typing ESC.

MichelleKramm_1-1646666622884.png

Appreciate if any comments on this

Thanks

Michelle


1 ACCEPTED SOLUTION
Syk
Resident Rockstar
Resident Rockstar

You've just selected part of the graph, when you are interacting with the report it would filter to the group you just clicked. To deselect it just click it again!

View solution in original post

2 REPLIES 2
Syk
Resident Rockstar
Resident Rockstar

You've just selected part of the graph, when you are interacting with the report it would filter to the group you just clicked. To deselect it just click it again!

Anonymous
Not applicable

Ok, good. Thank you

Helpful resources

Announcements
FabCon and SQLCon Barcelona 2026

FabCon & SQLCon – Barcelona 2026

Join us in Barcelona for FabCon and SQLCon, the Fabric, Power BI, SQL, and AI community event. Save €200 with code FABCMTY200.

60 days of Data Days Carousel

Data Days 2026

Join Data Days 2026: 60 days of free live/on-demand sessions, challenges, study groups, and certification opportunities.

Power BI DataViz World Championships carousel

Power BI DataViz World Championships - June 2026

A new Power BI DataViz World Championship is coming this June! Don't miss out on submitting your entry.

Top Solution Authors