Get certified for free when you join Fabric Data Days 2026 and dive into Fabric, Power BI, SQL, AI, and other essential data skills.
Join nowJuly 7 - July 17 | Round 2 of the Power BI Dataviz World Championships. Don't miss your chance! Learn more
How can i get tooltips (with sub-data) in Line chart
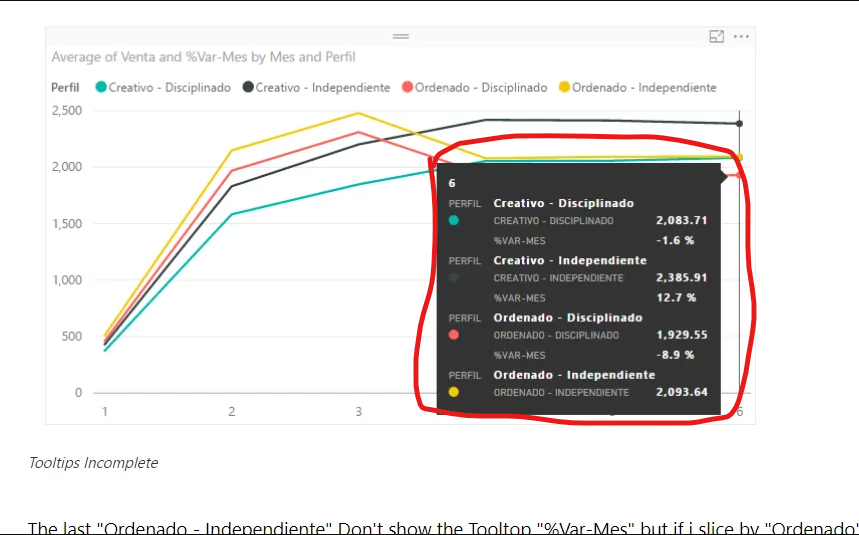
I want to show it like this picture.
thanks in advance
HI @Anonymous,
Did you mean to show the single data label at tooltips when you hover the mouse?
AFAIK, the current power bi will get the axis data point instead of detailed sub-data labels and you can't do custom with this. Perhaps you can submit an idea for this requirement.
Regards,
Xiaoxin Sheng
Thanks for replying me! Yes as you say Power bi will get the axis data point and in additional i want something like more info that related data point (to show in same tooltips when you hover mouse on that point) that what i mean sub-data of that point (sorry if i did you misunderstanding)
Hi @Anonymous
It looks like default tooltip in Power BI,
please see the below 2 videos to get the concept.
https://youtu.be/Aw_eYFtkt6c
https://youtu.be/FqUVxtlwaPI
Join us in Barcelona for FabCon and SQLCon, the Fabric, Power BI, SQL, and AI community event. Save €200 with code FABCMTY200.
If you love stickers, then you will definitely want to check out our community sticker challenge, Barcelona edition!
Check out the July 2026 Power BI update to learn about new features.
| User | Count |
|---|---|
| 30 | |
| 26 | |
| 23 | |
| 23 | |
| 14 |
| User | Count |
|---|---|
| 46 | |
| 33 | |
| 20 | |
| 18 | |
| 16 |