Forum Discussion

Time comparison multiple years
Hello everyone,
I’ve been struggling the past few days with DAX-formulas to compare several years.
On the internet there are several formulas but none of them gives me the result I want.
What’s the problem/challenge?
I’ve got 2 tables:
- Calendar;
- Model Fct_InvoiceLine, a fact-table with invoicelines from 2014-2018
I want to compare the number of customers and the amount of Sales during the years 2014-2018.
The result in the end:
- New customers: Number of customers and amount of Sales for each year
- Steady customers:
- Won revenue: number of customers and amount Sales for each year
- Steady: number of customers and amount Sales for each year
- Lost revenue: number of customers and amount Sales for each year
A steady customer is a customer with Sales in each year but the new Sales is more, less or the same as the previous year.
- Lost customers: Number of customers and amount of Sales for each year
My measures:
Total Turnover = SUM (‘Model Fct_InvoiceLine’[InvoiceLineTotalAmountExclVAT]
Number of Customers =
CALCULATE (
DISTINCTCOUNT ( ‘Model Fct_InvoiceLine’[Customernumber] );
FILTER ( ALL ( ‘Model Fct_InvoiceLine’[Customernumber] ); [Total Turnover] <> 0 )
)
The numbers from the measures mentioned above seems to be right.
At this point I need to go further but I’m lost.
I think that I have to make a virtual table with customernumber and sales for each year and after that I want to compare those tables with each other. I thought to use EXCEPT and SELECTEDCOLUMNS but I don’t know exactly how to use them.
Can you help me?
Thanks in advance,
Cor
8 Replies
 CiriaAdvocate III
Hi Anonymous
The function you neccesary need is SAMEPERIODLASTYEAR, or even better DATEADD.
With this function you can calculate multiple measures just changing intervals numbers.
About how clasiffy your clients, based on sales. You have to create a manual table, and then you can use Switch function to clasify each row or customer or whatever....
EnterpriseDNA has tutorials in youtube, but I cannot find it right now.
I've found this one from Curbal, which may help you with Virtual Tables and Summarize Function.
https://www.youtube.com/watch?v=-Ola264bKXk
Good luck!:smileyvery-happy:
- AnonymousNot applicable
Hi Ciria,
Thanks for your reply!
I've tried and tried and uptil now I haven't found a solution. I've made a dummy model and hopefully you can help me to count the customers for each year and the Sales.
The data:
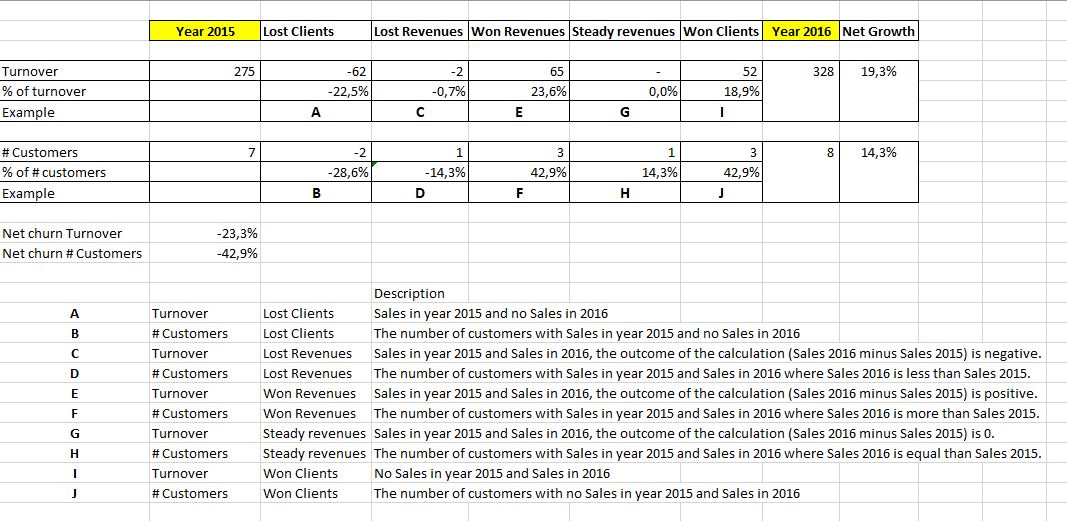
The report I want to calculate for each year:
The relationship I use between the 2 tables:
Hopefully you can help me with my challenge.
Thanks in advance,
Cor
- AnonymousNot applicable
I’ve made a mistake in the report: the lost revenues % # Customers was wrong. The correct report should be:
Report_example2.JPG1067x521 125 KBChrs,
Cor