Fabric Data Days starts November 4th!
Advance your Data & AI career with 50 days of live learning, dataviz contests, hands-on challenges, study groups & certifications and more!
Get registered- Power BI forums
- Get Help with Power BI
- Desktop
- Service
- Report Server
- Power Query
- Mobile Apps
- Developer
- DAX Commands and Tips
- Custom Visuals Development Discussion
- Health and Life Sciences
- Power BI Spanish forums
- Translated Spanish Desktop
- Training and Consulting
- Instructor Led Training
- Dashboard in a Day for Women, by Women
- Galleries
- Data Stories Gallery
- Themes Gallery
- Contests Gallery
- QuickViz Gallery
- Quick Measures Gallery
- Visual Calculations Gallery
- Notebook Gallery
- Translytical Task Flow Gallery
- TMDL Gallery
- R Script Showcase
- Webinars and Video Gallery
- Ideas
- Custom Visuals Ideas (read-only)
- Issues
- Issues
- Events
- Upcoming Events
Get Fabric Certified for FREE during Fabric Data Days. Don't miss your chance! Request now
- Power BI forums
- Forums
- Get Help with Power BI
- Desktop
- Target value to a column in table
- Subscribe to RSS Feed
- Mark Topic as New
- Mark Topic as Read
- Float this Topic for Current User
- Bookmark
- Subscribe
- Printer Friendly Page
- Mark as New
- Bookmark
- Subscribe
- Mute
- Subscribe to RSS Feed
- Permalink
- Report Inappropriate Content
Target value to a column in table
I have a parameter setup for user to input target production. I have a table that have percent allocation and associated price.
Something similar to the following. Based on target, I would like to display Weighted average Price in a Card.
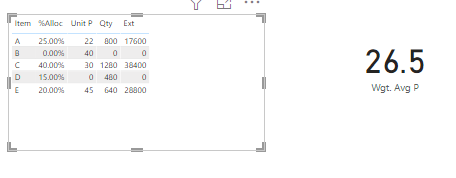
Tried Using measures for multiplying. While the Qty and Ext display properly, the Wgt. Avg is not returning proper value.
Can an
| Target: | 3200 | Parameter Input | ||
| TABLE | Calculated Columns | |||
| Item | % Alloc | Unit P | Qty (Target*% alloc) | Ext. (Qty*Unit P) |
| A | 25% | 22 | 800 | 17,600 |
| B | 0% | 40 | - | - |
| C | 40% | 30 | 1,280 | 38,400 |
| D | 15% | 0 | 480 | - |
| E | 20% | 45 | 640 | 28,800 |
| 3,200 | 84,800 | |||
| Wgt. Avg P | 26.5 |
Solved! Go to Solution.
- Mark as New
- Bookmark
- Subscribe
- Mute
- Subscribe to RSS Feed
- Permalink
- Report Inappropriate Content
Hi @chalapathy ,
Here are the steps you can follow:
1. Create measure.
Wgt. Avg P =
DIVIDE(
    SUMX(ALL('Table'),[Qty] * [Unit P])
    ,
    SUMX(ALL('Table'),'Table'[%Alloc])* 3200)
2. Result:
Best Regards,
Liu Yang
If this post helps, then please consider Accept it as the solution to help the other members find it more quickly
- Mark as New
- Bookmark
- Subscribe
- Mute
- Subscribe to RSS Feed
- Permalink
- Report Inappropriate Content
Thank you. Sorry for the late reply. It was long weekend and holidaying.
Helpful resources

Power BI Monthly Update - November 2025
Check out the November 2025 Power BI update to learn about new features.

Fabric Data Days
Advance your Data & AI career with 50 days of live learning, contests, hands-on challenges, study groups & certifications and more!

| User | Count |
|---|---|
| 98 | |
| 72 | |
| 50 | |
| 49 | |
| 42 |

