Join us at the 2025 Microsoft Fabric Community Conference
Microsoft Fabric Community Conference 2025, March 31 - April 2, Las Vegas, Nevada. Use code FABINSIDER for a $400 discount.
Register now- Power BI forums
- Get Help with Power BI
- Desktop
- Service
- Report Server
- Power Query
- Mobile Apps
- Developer
- DAX Commands and Tips
- Custom Visuals Development Discussion
- Health and Life Sciences
- Power BI Spanish forums
- Translated Spanish Desktop
- Training and Consulting
- Instructor Led Training
- Dashboard in a Day for Women, by Women
- Galleries
- Webinars and Video Gallery
- Data Stories Gallery
- Themes Gallery
- Power BI DataViz World Championships Gallery
- Quick Measures Gallery
- R Script Showcase
- COVID-19 Data Stories Gallery
- Community Connections & How-To Videos
- 2021 MSBizAppsSummit Gallery
- 2020 MSBizAppsSummit Gallery
- 2019 MSBizAppsSummit Gallery
- Events
- Ideas
- Custom Visuals Ideas (read-only)
- Issues
- Issues
- Events
- Upcoming Events
The Power BI DataViz World Championships are on! With four chances to enter, you could win a spot in the LIVE Grand Finale in Las Vegas. Show off your skills.
- Power BI forums
- Forums
- Get Help with Power BI
- Desktop
- Slicer for sales manager
- Subscribe to RSS Feed
- Mark Topic as New
- Mark Topic as Read
- Float this Topic for Current User
- Bookmark
- Subscribe
- Printer Friendly Page
- Mark as New
- Bookmark
- Subscribe
- Mute
- Subscribe to RSS Feed
- Permalink
- Report Inappropriate Content
Slicer for sales manager
Hello all,
I have a table of data like this:
| CustomerID | Customer Name | Sales |
| 1 | Walmart | 100,000 |
| 2 | Winco | 102,000 |
| 3 | Albertsons | 99,222 |
| 4 | Arco | 92,002 |
| 5 | Sams Club | 106,150 |
| 6 | Costco | 100,005 |
| 7 | Burgerville | 85,123 |
What I would like to do is create a slicer to show only data accocited with the Sales manager Bob:
These are the Customers Bob is accociated with (this table is not in Powerbi)
| Sales manager | CustomerID | Customer Name |
| Bob | 1 | Walmart |
| Bob | 2 | Winco |
| Bob | 3 | Albertsons |
| Bob | 4 | Arco |
What I would like is a slicer with two options: 1. Bob 2. All
this way I can isolate only bobs data.
What would be the best approach for this? I can upload the table with bobs data to build the slicer
Thank you!
Solved! Go to Solution.
- Mark as New
- Bookmark
- Subscribe
- Mute
- Subscribe to RSS Feed
- Permalink
- Report Inappropriate Content
Hi , @Anonymous
According to @camargos88 description, I made a demo you can refer to.
And could you please tell me whether your problem has been solved?
If it is, please mark the helpful replies or add your reply as Answered to close this thread.
Best Regards,
Community Support Team _ Eason
- Mark as New
- Bookmark
- Subscribe
- Mute
- Subscribe to RSS Feed
- Permalink
- Report Inappropriate Content
Create a table with two values Bob and All. and based on the selection change the measure. Refer
- Mark as New
- Bookmark
- Subscribe
- Mute
- Subscribe to RSS Feed
- Permalink
- Report Inappropriate Content
Hi @Anonymous ,
You can upload both tables and create a relationship between on Customer ID.
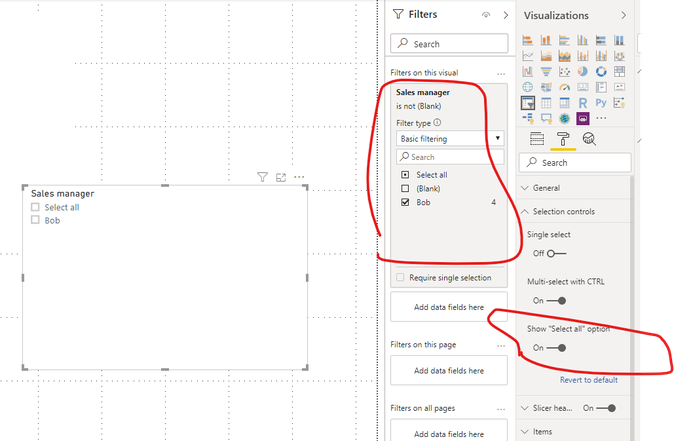
After that just change the slicer settings on Selection controls to allow the "Select All" option. Also, if u want to remove whe blank row on the slicer, just filter it on filter visual.
Ricardo
Helpful resources

Join us at the Microsoft Fabric Community Conference
March 31 - April 2, 2025, in Las Vegas, Nevada. Use code MSCUST for a $150 discount!

Power BI Monthly Update - February 2025
Check out the February 2025 Power BI update to learn about new features.

| User | Count |
|---|---|
| 86 | |
| 80 | |
| 53 | |
| 39 | |
| 39 |
| User | Count |
|---|---|
| 104 | |
| 85 | |
| 47 | |
| 44 | |
| 43 |

