FabCon is coming to Atlanta
Join us at FabCon Atlanta from March 16 - 20, 2026, for the ultimate Fabric, Power BI, AI and SQL community-led event. Save $200 with code FABCOMM.
Register now!- Power BI forums
- Get Help with Power BI
- Desktop
- Service
- Report Server
- Power Query
- Mobile Apps
- Developer
- DAX Commands and Tips
- Custom Visuals Development Discussion
- Health and Life Sciences
- Power BI Spanish forums
- Translated Spanish Desktop
- Training and Consulting
- Instructor Led Training
- Dashboard in a Day for Women, by Women
- Galleries
- Data Stories Gallery
- Themes Gallery
- Contests Gallery
- QuickViz Gallery
- Quick Measures Gallery
- Visual Calculations Gallery
- Notebook Gallery
- Translytical Task Flow Gallery
- TMDL Gallery
- R Script Showcase
- Webinars and Video Gallery
- Ideas
- Custom Visuals Ideas (read-only)
- Issues
- Issues
- Events
- Upcoming Events
The Power BI Data Visualization World Championships is back! Get ahead of the game and start preparing now! Learn more
- Power BI forums
- Forums
- Get Help with Power BI
- Desktop
- Re: Show top N values in clustered column chart
- Subscribe to RSS Feed
- Mark Topic as New
- Mark Topic as Read
- Float this Topic for Current User
- Bookmark
- Subscribe
- Printer Friendly Page
- Mark as New
- Bookmark
- Subscribe
- Mute
- Subscribe to RSS Feed
- Permalink
- Report Inappropriate Content
Show top N values in clustered column chart
I have column chart the x is date and the y is max of a numberic, the legned is the object type(contain 25 types every day). I only want to show object type of the top 3 y value
Solved! Go to Solution.
- Mark as New
- Bookmark
- Subscribe
- Mute
- Subscribe to RSS Feed
- Permalink
- Report Inappropriate Content
@Anonymous
Sample Table
| Category | Product | Sales |
| A | A1 | 200 |
| A | A2 | 250 |
| A | A3 | 300 |
| A | A4 | 350 |
| A | A5 | 400 |
| B | B1 | 450 |
| B | B2 | 500 |
| B | B3 | 550 |
| B | B4 | 600 |
| B | B5 | 650 |
| B | B6 | 700 |
SalesValue = SUM(CPS[Sales]) Rank =
var _selectedCategory= SELECTEDVALUE(CPS[Category])
var _rank=RANKX(FILTER(ALL(CPS),CPS[Category]=_selectedCategory),[SalesValue])
return _rank
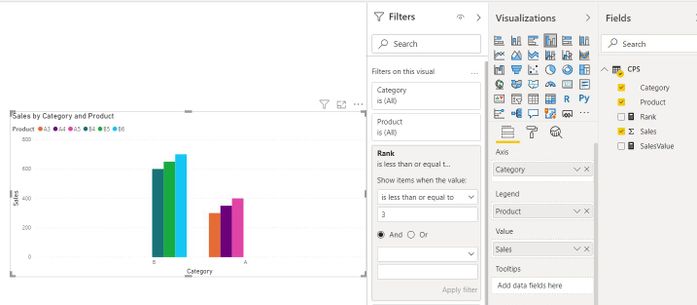
Now apply the visual level filter. (show item when the value: Rank is less than or equal to 3)
Did I answer your question? Mark my post as a solution!
Appreciate with a kudos 🙂
- Mark as New
- Bookmark
- Subscribe
- Mute
- Subscribe to RSS Feed
- Permalink
- Report Inappropriate Content
It's working for me. But why distance of each columns are too far and not aligned?
- Mark as New
- Bookmark
- Subscribe
- Mute
- Subscribe to RSS Feed
- Permalink
- Report Inappropriate Content
- Mark as New
- Bookmark
- Subscribe
- Mute
- Subscribe to RSS Feed
- Permalink
- Report Inappropriate Content
Thanks but that's not I want, I want to show top 3 types in every date.
- Mark as New
- Bookmark
- Subscribe
- Mute
- Subscribe to RSS Feed
- Permalink
- Report Inappropriate Content
@Anonymous
You have to create one measure for ranking.
Refer to this- https://www.sqlbi.com/articles/filtering-the-top-3-products-for-each-category-in-power-bi/
If you are still confused, please share your sample table and expected output.
Did I answer your question? Mark my post as a solution!
Appreciate with a kudos 🙂
- Mark as New
- Bookmark
- Subscribe
- Mute
- Subscribe to RSS Feed
- Permalink
- Report Inappropriate Content
- Mark as New
- Bookmark
- Subscribe
- Mute
- Subscribe to RSS Feed
- Permalink
- Report Inappropriate Content
@Anonymous
Sample Table
| Category | Product | Sales |
| A | A1 | 200 |
| A | A2 | 250 |
| A | A3 | 300 |
| A | A4 | 350 |
| A | A5 | 400 |
| B | B1 | 450 |
| B | B2 | 500 |
| B | B3 | 550 |
| B | B4 | 600 |
| B | B5 | 650 |
| B | B6 | 700 |
SalesValue = SUM(CPS[Sales]) Rank =
var _selectedCategory= SELECTEDVALUE(CPS[Category])
var _rank=RANKX(FILTER(ALL(CPS),CPS[Category]=_selectedCategory),[SalesValue])
return _rank
Now apply the visual level filter. (show item when the value: Rank is less than or equal to 3)
Did I answer your question? Mark my post as a solution!
Appreciate with a kudos 🙂
- Mark as New
- Bookmark
- Subscribe
- Mute
- Subscribe to RSS Feed
- Permalink
- Report Inappropriate Content
Thanks so much, it fixs my problem!
Helpful resources

Power BI Dataviz World Championships
The Power BI Data Visualization World Championships is back! Get ahead of the game and start preparing now!

| User | Count |
|---|---|
| 38 | |
| 38 | |
| 36 | |
| 28 | |
| 28 |
| User | Count |
|---|---|
| 124 | |
| 88 | |
| 74 | |
| 66 | |
| 65 |


