Fabric Data Days starts November 4th!
Advance your Data & AI career with 50 days of live learning, dataviz contests, hands-on challenges, study groups & certifications and more!
Get registered- Power BI forums
- Get Help with Power BI
- Desktop
- Service
- Report Server
- Power Query
- Mobile Apps
- Developer
- DAX Commands and Tips
- Custom Visuals Development Discussion
- Health and Life Sciences
- Power BI Spanish forums
- Translated Spanish Desktop
- Training and Consulting
- Instructor Led Training
- Dashboard in a Day for Women, by Women
- Galleries
- Data Stories Gallery
- Themes Gallery
- Contests Gallery
- Quick Measures Gallery
- Visual Calculations Gallery
- Notebook Gallery
- Translytical Task Flow Gallery
- TMDL Gallery
- R Script Showcase
- Webinars and Video Gallery
- Ideas
- Custom Visuals Ideas (read-only)
- Issues
- Issues
- Events
- Upcoming Events
Join us at FabCon Atlanta from March 16 - 20, 2026, for the ultimate Fabric, Power BI, AI and SQL community-led event. Save $200 with code FABCOMM. Register now.
- Power BI forums
- Forums
- Get Help with Power BI
- Desktop
- Show summary value if all data in child are availa...
- Subscribe to RSS Feed
- Mark Topic as New
- Mark Topic as Read
- Float this Topic for Current User
- Bookmark
- Subscribe
- Printer Friendly Page
- Mark as New
- Bookmark
- Subscribe
- Mute
- Subscribe to RSS Feed
- Permalink
- Report Inappropriate Content
Show summary value if all data in child are available in matrix table
Hello,
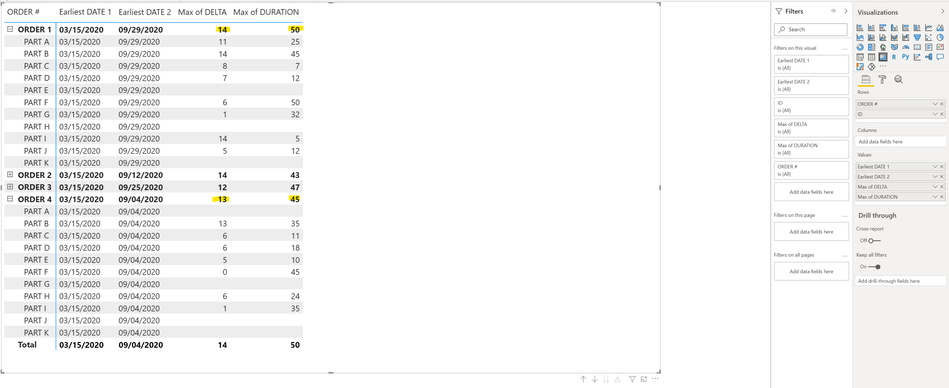
I have the below table.
I would only like to show the summary value (highlighted in yellow) if all the child level line items (parts) have a value.
For example when collapsed Order 1 has the min of Date 1 and 2 shown because all parts have a value. I don't want it to show the max of "Duration" or "Delta" because not all parts have the data populated in the table (parts e,h,k) for order 1.
My sample data can be found here:
https://drive.google.com/file/d/18zPhPAyLcmNFvU-YK8-BLITiZYwN1jc5/view?usp=sharing
- Mark as New
- Bookmark
- Subscribe
- Mute
- Subscribe to RSS Feed
- Permalink
- Report Inappropriate Content
Hi, @Anonymous
According to your description, you want to show summary value if all data in a child are available in the Matrix, I think you can achieve this by changing the data summarize type.
You can click on column [DURATION] and [DELTA], then change the data summarize type to “Sum”, like this:
And I guess this is what you want.
If this result is not what you want, you can show more detail of your requirement clearly so that we can help you in advance.
How to Get Your Question Answered Quickly
Best Regards,
Community Support Team _Robert Qin
If this post helps, then please consider Accept it as the solution to help the other members find it more quickly.
- Mark as New
- Bookmark
- Subscribe
- Mute
- Subscribe to RSS Feed
- Permalink
- Report Inappropriate Content
@Anonymous
You can either:
1) Upload a file to a cloud service (OneDrive, Dropbox, Google Drive...) and share the link from there.
2) Copy and paste the table into the "insert table" option (click on the elypsis in the message menu bar to display further options)
This link is helpful btw:
How to get your question answered quickly
Did I answer your question? Mark my post as a solution!
In doing so, you are also helping me. Thank you!
Proud to be a Super User!
Paul on Linkedin.
- Mark as New
- Bookmark
- Subscribe
- Mute
- Subscribe to RSS Feed
- Permalink
- Report Inappropriate Content
I edited the question and also added a screenshot of powerbi. I added the link to a sample file.
- Mark as New
- Bookmark
- Subscribe
- Mute
- Subscribe to RSS Feed
- Permalink
- Report Inappropriate Content
below is how the data is structured
- Mark as New
- Bookmark
- Subscribe
- Mute
- Subscribe to RSS Feed
- Permalink
- Report Inappropriate Content
@Anonymous
Sorry but we cannot work on an image. We need actual data!
Did I answer your question? Mark my post as a solution!
In doing so, you are also helping me. Thank you!
Proud to be a Super User!
Paul on Linkedin.
- Mark as New
- Bookmark
- Subscribe
- Mute
- Subscribe to RSS Feed
- Permalink
- Report Inappropriate Content
How do I upload the excel file to this thread
- Mark as New
- Bookmark
- Subscribe
- Mute
- Subscribe to RSS Feed
- Permalink
- Report Inappropriate Content
@Anonymous
Can you please provide actual sample data (as opposed to an image)?
Did I answer your question? Mark my post as a solution!
In doing so, you are also helping me. Thank you!
Proud to be a Super User!
Paul on Linkedin.
Helpful resources

Fabric Data Days
Advance your Data & AI career with 50 days of live learning, contests, hands-on challenges, study groups & certifications and more!

Power BI Monthly Update - October 2025
Check out the October 2025 Power BI update to learn about new features.

| User | Count |
|---|---|
| 76 | |
| 37 | |
| 31 | |
| 29 | |
| 26 |


