FabCon is coming to Atlanta
Join us at FabCon Atlanta from March 16 - 20, 2026, for the ultimate Fabric, Power BI, AI and SQL community-led event. Save $200 with code FABCOMM.
Register now!- Power BI forums
- Get Help with Power BI
- Desktop
- Service
- Report Server
- Power Query
- Mobile Apps
- Developer
- DAX Commands and Tips
- Custom Visuals Development Discussion
- Health and Life Sciences
- Power BI Spanish forums
- Translated Spanish Desktop
- Training and Consulting
- Instructor Led Training
- Dashboard in a Day for Women, by Women
- Galleries
- Data Stories Gallery
- Themes Gallery
- Contests Gallery
- Quick Measures Gallery
- Notebook Gallery
- Translytical Task Flow Gallery
- TMDL Gallery
- R Script Showcase
- Webinars and Video Gallery
- Ideas
- Custom Visuals Ideas (read-only)
- Issues
- Issues
- Events
- Upcoming Events
To celebrate FabCon Vienna, we are offering 50% off select exams. Ends October 3rd. Request your discount now.
- Power BI forums
- Forums
- Get Help with Power BI
- Desktop
- Show average of column values in grand total row
- Subscribe to RSS Feed
- Mark Topic as New
- Mark Topic as Read
- Float this Topic for Current User
- Bookmark
- Subscribe
- Printer Friendly Page
- Mark as New
- Bookmark
- Subscribe
- Mute
- Subscribe to RSS Feed
- Permalink
- Report Inappropriate Content
Show average of column values in grand total row
Hi,
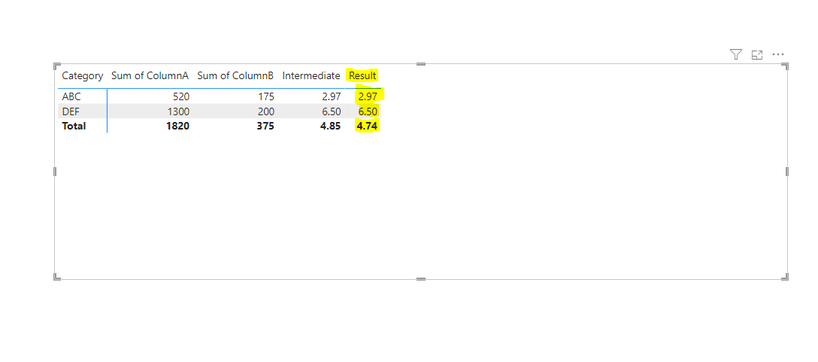
I will try to explain my issue by taking an example. Please refer below screenshot. I need help to implement Yellow highlighted part.
There is a column called "Result" which is a measure by dividing Column A and Column B.
In the Grand total row of the matrix, I want to show "Result" value as an Average.
So from the above screenshot value, I want value as 3.5. But instead I am getting 4.4 because 550/125.
How to achieve 3.5 as a value in "Result" grand total.
Solved! Go to Solution.
- Mark as New
- Bookmark
- Subscribe
- Mute
- Subscribe to RSS Feed
- Permalink
- Report Inappropriate Content
Hi,
I figured out the solution in case any one needed this. This may not be optimized solution but one can optimize as per the requirement.
So I have created four measures basically.
MeasureA =SUM('Sample'[ColumnA])

MeasureB = SUM('Sample'[ColumnB])

IntermediateMeasure = MeasureA/MeasureB


ResultMeasure =


VAR TotalResults = SUM('Sample'[ColumnA]) / SUM('Sample'[ColumnB])
VAR DistinctCategoryCount = DISTINCTCOUNT('Sample'[Category])
RETURN
    IF(
        ISFILTERED('Sample'[Category]),
        DIVIDE(TotalResults, DistinctCategoryCount),
        AVERAGEX(VALUES('Sample'[Category]), [IntermediateMeasure ])
    )
Here is the screenshot of the result :

- Mark as New
- Bookmark
- Subscribe
- Mute
- Subscribe to RSS Feed
- Permalink
- Report Inappropriate Content
Hello @Kandarp ,
Use AVERAGEX instead of AVERAGE directly to get the overall average work the same.
Your measure looks like this:
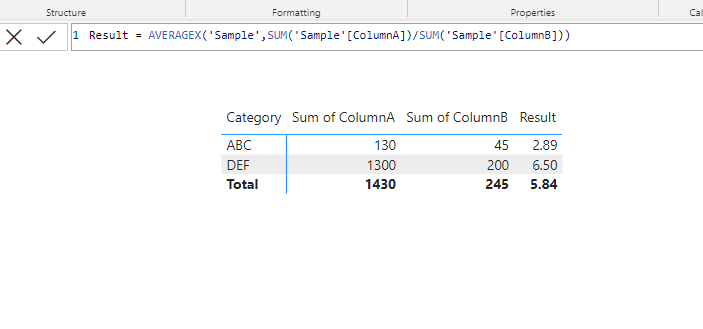
Average = AVERAGEX('Table','Table'[A]/'Table'[B])Output looks like this:
If this post helps, then please consider accepting it as the solution to help other members find it more quickly. Thank You!!
- Mark as New
- Bookmark
- Subscribe
- Mute
- Subscribe to RSS Feed
- Permalink
- Report Inappropriate Content
@Kishore_KVN Thanks this is perfect solution. But It will not work if we have multiple row with same category. In my case I have mutliple rows with same category name.
For example, if we have below data :
Then suggested solution will not work. Expected result is 4.695 but this formula shows 5.84. See below :
If you have any solution on this, please suggest. Thanks in advance.
- Mark as New
- Bookmark
- Subscribe
- Mute
- Subscribe to RSS Feed
- Permalink
- Report Inappropriate Content
Hello @Kandarp in that case you have to add grouping for the category.
Average = Calculate(AVERAGEX('Table',sum('Table'[A])/sum('Table'[B])),ALLEXCEPT(Table,'Table'[Category]))
If this post helps, then please consider accepting it as the solution to help other members find it more quickly. Thank You!!
- Mark as New
- Bookmark
- Subscribe
- Mute
- Subscribe to RSS Feed
- Permalink
- Report Inappropriate Content
Helpful resources
| User | Count |
|---|---|
| 98 | |
| 75 | |
| 74 | |
| 49 | |
| 26 |


