Fabric Data Days starts November 4th!
Advance your Data & AI career with 50 days of live learning, dataviz contests, hands-on challenges, study groups & certifications and more!
Get registered- Power BI forums
- Get Help with Power BI
- Desktop
- Service
- Report Server
- Power Query
- Mobile Apps
- Developer
- DAX Commands and Tips
- Custom Visuals Development Discussion
- Health and Life Sciences
- Power BI Spanish forums
- Translated Spanish Desktop
- Training and Consulting
- Instructor Led Training
- Dashboard in a Day for Women, by Women
- Galleries
- Data Stories Gallery
- Themes Gallery
- Contests Gallery
- QuickViz Gallery
- Quick Measures Gallery
- Visual Calculations Gallery
- Notebook Gallery
- Translytical Task Flow Gallery
- TMDL Gallery
- R Script Showcase
- Webinars and Video Gallery
- Ideas
- Custom Visuals Ideas (read-only)
- Issues
- Issues
- Events
- Upcoming Events
Get Fabric Certified for FREE during Fabric Data Days. Don't miss your chance! Request now
- Power BI forums
- Forums
- Get Help with Power BI
- Desktop
- Scatter graph with values from two tables that hav...
- Subscribe to RSS Feed
- Mark Topic as New
- Mark Topic as Read
- Float this Topic for Current User
- Bookmark
- Subscribe
- Printer Friendly Page
- Mark as New
- Bookmark
- Subscribe
- Mute
- Subscribe to RSS Feed
- Permalink
- Report Inappropriate Content
Scatter graph with values from two tables that have no relationship
Hi peeps,
I am trying to build a scatter graph with two data points, stored in seperate tables.
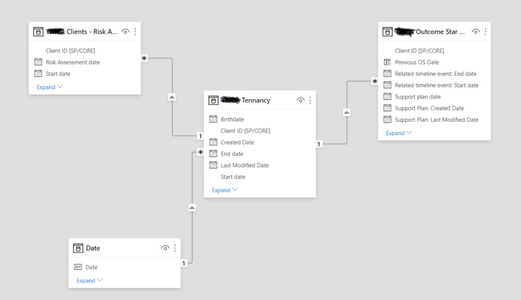
I have 4 tables:
Clients = 1 row per client with a unique ID
Risk = Many rows per client based on a timestamp with unique ID depending on how many assessments have been undertaken
Outcome = many rows per client based on a timestamp with a unique ID depending on how many assessments have been undertaken
Date Table
The model is working OK, as I have created measures to give me the visuals and results I need when looking at first or last value in each table.
However what I need to do is to create a scatter graph that has:
The Risk level # ( 1 - 4 ) for each intervention on the X axis
The Outcome score for each intervention on the Y axis - this is an average score as a number
This will show all the pairs of assessments and compare each score
When I place each value in the visual it will not work as there is no relationship between the two tables (the model shows this) and as I have 3 fact tables it is not really a star schema.
My question is:
How can I bring each data point into the scatter graph?
I thought that I can create a measure that will give me each clients individual average score to put into the visual and not have a need for a relationship between the two columns, because the measure will add the values for me. . . but I think I am overthinking in my rush to meet the deadline. . .
here is the column, that I want replicate each score e.g. 16791 would have 7 points of data from this table and 7 points from the other table in the visual (I have a different unique ID this is part of the table)
I think this is pretty straight forwards, but I currently have brain freeze, hence reaching out on the forum.
Thanks for any help 🙂
- Mark as New
- Bookmark
- Subscribe
- Mute
- Subscribe to RSS Feed
- Permalink
- Report Inappropriate Content
Hi @DemoFour ,
I'm not very clear about your requirement. Could you please share some sample data(exclude sensitive data) in table Clients, Risk and Outcome and your expected result with backend logic and specific examples in order to provide you a suitable solution? It is better if you can share a simple sample pbix file. Thank you.
Best Regards
- Mark as New
- Bookmark
- Subscribe
- Mute
- Subscribe to RSS Feed
- Permalink
- Report Inappropriate Content
Hi @Anonymous
My apologies for not replying, I will draw something together and then add the file. thank you for your offer of help, I will get back to you ASAP.
Have a nice day.
Helpful resources

Power BI Monthly Update - November 2025
Check out the November 2025 Power BI update to learn about new features.

Fabric Data Days
Advance your Data & AI career with 50 days of live learning, contests, hands-on challenges, study groups & certifications and more!

| User | Count |
|---|---|
| 97 | |
| 70 | |
| 50 | |
| 42 | |
| 40 |


