FabCon is coming to Atlanta
Join us at FabCon Atlanta from March 16 - 20, 2026, for the ultimate Fabric, Power BI, AI and SQL community-led event. Save $200 with code FABCOMM.
Register now!- Power BI forums
- Get Help with Power BI
- Desktop
- Service
- Report Server
- Power Query
- Mobile Apps
- Developer
- DAX Commands and Tips
- Custom Visuals Development Discussion
- Health and Life Sciences
- Power BI Spanish forums
- Translated Spanish Desktop
- Training and Consulting
- Instructor Led Training
- Dashboard in a Day for Women, by Women
- Galleries
- Data Stories Gallery
- Themes Gallery
- Contests Gallery
- QuickViz Gallery
- Quick Measures Gallery
- Visual Calculations Gallery
- Notebook Gallery
- Translytical Task Flow Gallery
- TMDL Gallery
- R Script Showcase
- Webinars and Video Gallery
- Ideas
- Custom Visuals Ideas (read-only)
- Issues
- Issues
- Events
- Upcoming Events
Get Fabric Certified for FREE during Fabric Data Days. Don't miss your chance! Request now
- Power BI forums
- Forums
- Get Help with Power BI
- Desktop
- Scatter chart - issue with date order
- Subscribe to RSS Feed
- Mark Topic as New
- Mark Topic as Read
- Float this Topic for Current User
- Bookmark
- Subscribe
- Printer Friendly Page
- Mark as New
- Bookmark
- Subscribe
- Mute
- Subscribe to RSS Feed
- Permalink
- Report Inappropriate Content
Scatter chart - issue with date order
Hi all,
I just wanted to raise an issue that I’ve encountered with date orders in relation to the scatter chart in Power BI.
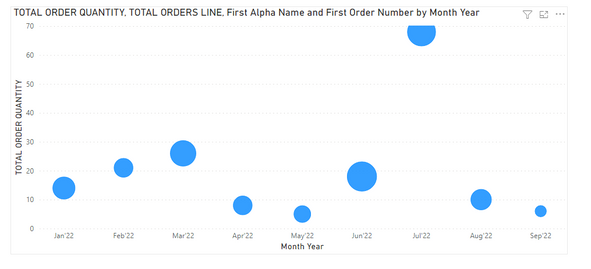
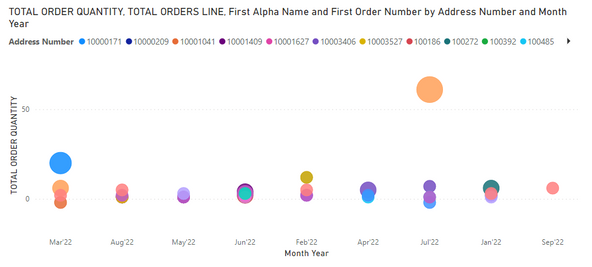
Essentially, my problem is that, whenever I populate the “legend” element of the graph, it completely scrambles the date order. The date order is absolutely fine when the “legend” is empty. Please see the examples below, first with the legend empty and then with the legend populated:
Please note that this is using a custom date table.
I was wondering if anybody could advise where I’m going wrong here?
Many thanks!
Adam
- Mark as New
- Bookmark
- Subscribe
- Mute
- Subscribe to RSS Feed
- Permalink
- Report Inappropriate Content
Hi, I am having the same issue as OP. The dates are out of order on using legend.
Without Legend:
With legend:
- Mark as New
- Bookmark
- Subscribe
- Mute
- Subscribe to RSS Feed
- Permalink
- Report Inappropriate Content
hi, @Anonymous
I have test on my side, it works well.
And "legend" value shouldn't affect the order of x-axis. If you try to change the sort of visual as below;
If you still have the problem, please share a simple sample pbix file.
You can upload it to OneDrive and post the link here. Do mask sensitive data before uploading.
Best Regards,
Lin
If this post helps, then please consider Accept it as the solution to help the other members find it more quickly.
- Mark as New
- Bookmark
- Subscribe
- Mute
- Subscribe to RSS Feed
- Permalink
- Report Inappropriate Content
Hi Lin,
Thank you for getting back to me, apologies for the delayed reply.
I have a test file but don't believe that I can post a link to it here via OneDrive as it would expose my company's internal OneDrive site - is there an alternative way that i can post a Power BI file for general access?
Many thanks,
AJS
Helpful resources

Power BI Monthly Update - November 2025
Check out the November 2025 Power BI update to learn about new features.

Fabric Data Days
Advance your Data & AI career with 50 days of live learning, contests, hands-on challenges, study groups & certifications and more!


