Join us at the 2025 Microsoft Fabric Community Conference
March 31 - April 2, 2025, in Las Vegas, Nevada. Use code MSCUST for a $150 discount! Early bird discount ends December 31.
Register Now- Power BI forums
- Get Help with Power BI
- Desktop
- Service
- Report Server
- Power Query
- Mobile Apps
- Developer
- DAX Commands and Tips
- Custom Visuals Development Discussion
- Health and Life Sciences
- Power BI Spanish forums
- Translated Spanish Desktop
- Training and Consulting
- Instructor Led Training
- Dashboard in a Day for Women, by Women
- Galleries
- Community Connections & How-To Videos
- COVID-19 Data Stories Gallery
- Themes Gallery
- Data Stories Gallery
- R Script Showcase
- Webinars and Video Gallery
- Quick Measures Gallery
- 2021 MSBizAppsSummit Gallery
- 2020 MSBizAppsSummit Gallery
- 2019 MSBizAppsSummit Gallery
- Events
- Ideas
- Custom Visuals Ideas
- Issues
- Issues
- Events
- Upcoming Events
Be one of the first to start using Fabric Databases. View on-demand sessions with database experts and the Microsoft product team to learn just how easy it is to get started. Watch now
- Power BI forums
- Forums
- Get Help with Power BI
- Desktop
- Re: Running Total Based on Budget Division by Dura...
- Subscribe to RSS Feed
- Mark Topic as New
- Mark Topic as Read
- Float this Topic for Current User
- Bookmark
- Subscribe
- Printer Friendly Page
- Mark as New
- Bookmark
- Subscribe
- Mute
- Subscribe to RSS Feed
- Permalink
- Report Inappropriate Content
Running Total Based on Budget Division by Duration
Hi There,
I need a solution to this problem, please.
My dataset looks like below
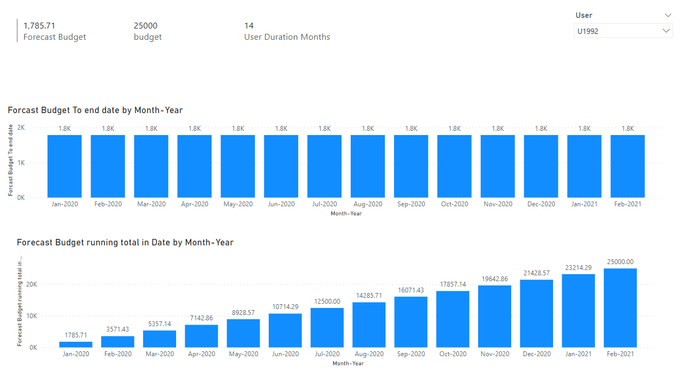
So I need to split the total budget into number of months from the start date to the end date. Which is divide (total budget, duration (months) which gives me the budget expected to spend per month.
However, I need to do a running total on this budget per month to show how much the budget should have been spent.
I used this formula below and the result isn't accumulating

I would like this chat above to be in cumulative form.
Please help!
Solved! Go to Solution.
- Mark as New
- Bookmark
- Subscribe
- Mute
- Subscribe to RSS Feed
- Permalink
- Report Inappropriate Content
Hi @BGB
please try
Forecast Budget running total in Date =
CALCULATE (
    SUMX (
        VALUES ( 'DateTable'[Month-Year] ),
        CALCULATE ( DIVIDE ( SUM ( Sheet1[budget] ), [User Duration Months] ) )
    ),
    ALLSELECTED ( 'DateTable' ),
    'DateTable'[Date] <= MAX ( 'DateTable'[Date] )
)
- Mark as New
- Bookmark
- Subscribe
- Mute
- Subscribe to RSS Feed
- Permalink
- Report Inappropriate Content

- Mark as New
- Bookmark
- Subscribe
- Mute
- Subscribe to RSS Feed
- Permalink
- Report Inappropriate Content
Hi @BGB
please try
Forecast Budget running total in Date =
CALCULATE (
    SUMX (
        VALUES ( 'DateTable'[Month-Year] ),
        CALCULATE ( DIVIDE ( SUM ( Sheet1[budget] ), [User Duration Months] ) )
    ),
    ALLSELECTED ( 'DateTable' ),
    'DateTable'[Date] <= MAX ( 'DateTable'[Date] )
)
- Mark as New
- Bookmark
- Subscribe
- Mute
- Subscribe to RSS Feed
- Permalink
- Report Inappropriate Content
@tamerj1 Thanks for replying to this query.
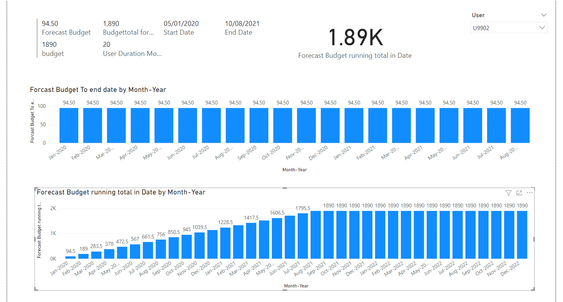
This almost worked, except that the incremental is not on the user ID level. For example, in the picture below, the increment should start from 94.5 and go up each month by that value, as the top visual shows. However, I think this is going up by all the budget given for all users which is why its in thousands already.
I'm guessing there is something we need to add, probably sumx or maxx or even change where we have applied sumx and maxx in the measure.
Thanks for your help so far. Looking forward to hearing from you.
- Mark as New
- Bookmark
- Subscribe
- Mute
- Subscribe to RSS Feed
- Permalink
- Report Inappropriate Content
Please try
Forecast Budget running total in Date =
CALCULATE (
    SUMX (
        CROSSJOIN ( VALUES ( 'DateTable'[Month-Year] ), VALUES ( Sheet1[User] ) ),
        CALCULATE ( DIVIDE ( SUM ( Sheet1[budget] ), [User Duration Months] ) )
    ),
    ALLSELECTED ( 'DateTable' ),
    'DateTable'[Date] <= MAX ( 'DateTable'[Date] )
)- Mark as New
- Bookmark
- Subscribe
- Mute
- Subscribe to RSS Feed
- Permalink
- Report Inappropriate Content
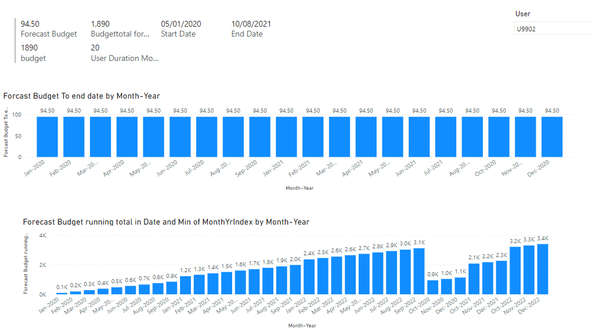
I change your first measure a bit and seems to work to as extent .
-------
This gives me budget expected per month

The only thing now is, I would like the budget to stop from on the enddate month and not go on till the end of my calendar table. This is so each user have a dynamic end date based on the entered end date.
Helpful resources

Join us at the Microsoft Fabric Community Conference
March 31 - April 2, 2025, in Las Vegas, Nevada. Use code MSCUST for a $150 discount!

We want your feedback!
Your insights matter. That’s why we created a quick survey to learn about your experience finding answers to technical questions.

Microsoft Fabric Community Conference 2025
Arun Ulag shares exciting details about the Microsoft Fabric Conference 2025, which will be held in Las Vegas, NV.

| User | Count |
|---|---|
| 123 | |
| 85 | |
| 85 | |
| 70 | |
| 51 |
| User | Count |
|---|---|
| 205 | |
| 153 | |
| 97 | |
| 79 | |
| 69 |


