FabCon is coming to Atlanta
Join us at FabCon Atlanta from March 16 - 20, 2026, for the ultimate Fabric, Power BI, AI and SQL community-led event. Save $200 with code FABCOMM.
Register now!- Power BI forums
- Get Help with Power BI
- Desktop
- Service
- Report Server
- Power Query
- Mobile Apps
- Developer
- DAX Commands and Tips
- Custom Visuals Development Discussion
- Health and Life Sciences
- Power BI Spanish forums
- Translated Spanish Desktop
- Training and Consulting
- Instructor Led Training
- Dashboard in a Day for Women, by Women
- Galleries
- Data Stories Gallery
- Themes Gallery
- Contests Gallery
- QuickViz Gallery
- Quick Measures Gallery
- Visual Calculations Gallery
- Notebook Gallery
- Translytical Task Flow Gallery
- TMDL Gallery
- R Script Showcase
- Webinars and Video Gallery
- Ideas
- Custom Visuals Ideas (read-only)
- Issues
- Issues
- Events
- Upcoming Events
Get Fabric Certified for FREE during Fabric Data Days. Don't miss your chance! Request now
- Power BI forums
- Forums
- Get Help with Power BI
- Desktop
- Row context by agent and by customers
- Subscribe to RSS Feed
- Mark Topic as New
- Mark Topic as Read
- Float this Topic for Current User
- Bookmark
- Subscribe
- Printer Friendly Page
- Mark as New
- Bookmark
- Subscribe
- Mute
- Subscribe to RSS Feed
- Permalink
- Report Inappropriate Content
Row context by agent and by customers
Hi everyone.
I have an Issue:
I need to make a distribution of Sales Agent Salaries by Customer. And the distribution it will depend the amount of sales of each customer of each agent from the total of sales of each agent, i.e.:
Agent "Tomas"
Period April 2022
Salary $10.000
Sales of Tomas: 100.000 units
This agent has 4 customers:
Customer 1 bought 20.000 units
Customer 2 bought 30.000 units
Customer 3 bought 25.000 units
Customer 4 bought 25.000 units
So the distribution of the salary will be:
Customer 1: $10.000 * (20.000 / 100.000) = $2.000
Customer 2: $10.000 * (30.000 / 100.000) = $3.000
Customer 3: $10.000 * (25.000 / 100.000) = $2.500
Customer 4: $10.000 * (25.000 / 100.000) = $2.500
I solved it using a Matrix with Agents first in the "Row" fields, and then each customer inside.
And it is a Matrix like this:
But I want to show it by Customer and a Table shape not Matrix and not by Agent, like this:
Is it possible?
Solved! Go to Solution.
- Mark as New
- Bookmark
- Subscribe
- Mute
- Subscribe to RSS Feed
- Permalink
- Report Inappropriate Content
Hi @MarceloDF ,
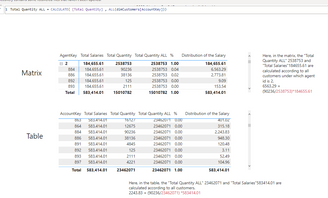
Thanks for your reply. That is because they are calculated by different values such as "Total Quantity ALL" and "Total Salaries".
I marked them in the screenshot below.
To solve this, you just need to add a slicer. Put "AgentKey" to the slicer and you will get the expected result.
I attach my sample below for your reference.
Best Regards,
Community Support Team _ xiaosun
If this post helps, then please consider Accept it as the solution to help the other members find it more quickly.
- Mark as New
- Bookmark
- Subscribe
- Mute
- Subscribe to RSS Feed
- Permalink
- Report Inappropriate Content
Mmmm ok, didn't work. I will clarify a little bit the explanation.
I created a PBIX in order that it will be more clearly to you to understand the relationship of the tables
PBIX File
- Mark as New
- Bookmark
- Subscribe
- Mute
- Subscribe to RSS Feed
- Permalink
- Report Inappropriate Content
Hi @MarceloDF ,
In the previous solution for you, I think the "table" of "I want to show it by Customer and a Table shape not Matrix and not by Agent" in your description is the visual shown below.
After looking at your example, I found that the two tables are both in Matrix and the measures you created is consistent with the solution I gave you. If you put them in a "table", it will show the correct result.
Or rather, maybe you want to show it by Customer and a Matrix??
Best Regards,
Community Support Team _ xiaosun
If this post helps, then please consider Accept it as the solution to help the other members find it more quickly.
- Mark as New
- Bookmark
- Subscribe
- Mute
- Subscribe to RSS Feed
- Permalink
- Report Inappropriate Content
Okay, with those screenshots I saw that there is a behavior that I didn't know about that.
I put the second one as a table to be congruent with what I want.
Look, when I go to my example without filter:
But when I choose the customer in the Matrix, the numbers change. Can you explain me this?
- Mark as New
- Bookmark
- Subscribe
- Mute
- Subscribe to RSS Feed
- Permalink
- Report Inappropriate Content
Hi @MarceloDF ,
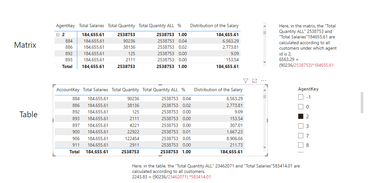
Thanks for your reply. That is because they are calculated by different values such as "Total Quantity ALL" and "Total Salaries".
I marked them in the screenshot below.
To solve this, you just need to add a slicer. Put "AgentKey" to the slicer and you will get the expected result.
I attach my sample below for your reference.
Best Regards,
Community Support Team _ xiaosun
If this post helps, then please consider Accept it as the solution to help the other members find it more quickly.
- Mark as New
- Bookmark
- Subscribe
- Mute
- Subscribe to RSS Feed
- Permalink
- Report Inappropriate Content
Sorry for the delay, I was a little bit busy.
The problem is that I add the Agent slicer, but brokes me some other measures that I have in the same report that are calculated by customer.
Also, I have a lot of measures that are being summed by customer, but this measure that is calculated by Agent, is not summing the value of the customer only, it is summing the entire value of the agent.
- Mark as New
- Bookmark
- Subscribe
- Mute
- Subscribe to RSS Feed
- Permalink
- Report Inappropriate Content
Hi @MarceloDF ,
According to your description, here is my solution.
It means that you have a column named Customer ID.
Please create two columns in table.
% = 'Tabelle1'[Quantity]/SUM(Tabelle1[Quantity])Money by Customer = SUM(Tabelle1[Quantity])*'Tabelle1'[%]Final output:
I attach my sample below for your reference.
Best Regards,
Community Support Team _ xiaosun
If this post helps, then please consider Accept it as the solution to help the other members find it more quickly.
Helpful resources

Power BI Monthly Update - November 2025
Check out the November 2025 Power BI update to learn about new features.

Fabric Data Days
Advance your Data & AI career with 50 days of live learning, contests, hands-on challenges, study groups & certifications and more!

| User | Count |
|---|---|
| 101 | |
| 76 | |
| 56 | |
| 51 | |
| 46 |


