This time we’re going bigger than ever. Fabric, Power BI, SQL, AI and more. We're covering it all. You won't want to miss it.
Learn moreLevel up your Power BI skills this month - build one visual each week and tell better stories with data! Get started
Hello,
I'm having some trouble getting the following table to work.
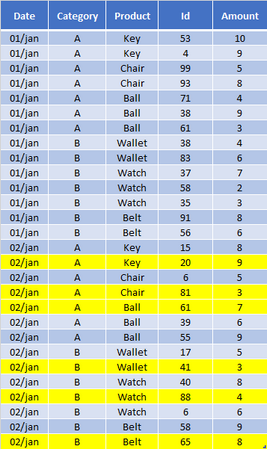
I have the following database (it's simplified, I actually have information in different connected tables 😞
I want a matrix table summarized by the amount of each product for the max date (and within that date, I want the row with the max "Id"). The highlighted rows are the desired ones for the output.
The resulting matrix should look like this:
So I'd have a measure that returns the most recent amount (highest "date", then highest "Id") for each product, and summarize the group with the sum for each item. I tried using SUMMARIZE with no success.
Thanks in advance!
Solved! Go to Solution.
Hi @lucasattom ,
I think you can try this code to create a measure.
Output =
VAR _AddColumn =
ADDCOLUMNS (
FILTER ( 'Table', 'Table'[Date] = MAX ( 'Table'[Date] ) ),
"MAXID",
CALCULATE (
MAX ( 'Table'[Id] ),
FILTER (
ALLEXCEPT ( 'Table', 'Table'[Category], 'Table'[Product] ),
'Table'[Date] = MAX ( 'Table'[Date] )
)
)
)
VAR _Filter =
FILTER ( _AddColumn, [Id] = [MAXID] )
RETURN
SUMX ( _Filter, [Amount] )
Result is as below.
Best Regards,
Rico Zhou
If this post helps, then please consider Accept it as the solution to help the other members find it more quickly.
Hi @lucasattom ,
I think you can try this code to create a measure.
Output =
VAR _AddColumn =
ADDCOLUMNS (
FILTER ( 'Table', 'Table'[Date] = MAX ( 'Table'[Date] ) ),
"MAXID",
CALCULATE (
MAX ( 'Table'[Id] ),
FILTER (
ALLEXCEPT ( 'Table', 'Table'[Category], 'Table'[Product] ),
'Table'[Date] = MAX ( 'Table'[Date] )
)
)
)
VAR _Filter =
FILTER ( _AddColumn, [Id] = [MAXID] )
RETURN
SUMX ( _Filter, [Amount] )
Result is as below.
Best Regards,
Rico Zhou
If this post helps, then please consider Accept it as the solution to help the other members find it more quickly.
Check out the April 2026 Power BI update to learn about new features.
Sign up to receive a private message when registration opens and key events begin.
If you have recently started exploring Fabric, we'd love to hear how it's going. Your feedback can help with product improvements.
| User | Count |
|---|---|
| 36 | |
| 28 | |
| 28 | |
| 20 | |
| 18 |
| User | Count |
|---|---|
| 65 | |
| 35 | |
| 34 | |
| 25 | |
| 24 |