Join us at the 2025 Microsoft Fabric Community Conference
March 31 - April 2, 2025, in Las Vegas, Nevada. Use code MSCUST for a $150 discount! Early bird discount ends December 31.
Register Now- Power BI forums
- Get Help with Power BI
- Desktop
- Service
- Report Server
- Power Query
- Mobile Apps
- Developer
- DAX Commands and Tips
- Custom Visuals Development Discussion
- Health and Life Sciences
- Power BI Spanish forums
- Translated Spanish Desktop
- Training and Consulting
- Instructor Led Training
- Dashboard in a Day for Women, by Women
- Galleries
- Community Connections & How-To Videos
- COVID-19 Data Stories Gallery
- Themes Gallery
- Data Stories Gallery
- R Script Showcase
- Webinars and Video Gallery
- Quick Measures Gallery
- 2021 MSBizAppsSummit Gallery
- 2020 MSBizAppsSummit Gallery
- 2019 MSBizAppsSummit Gallery
- Events
- Ideas
- Custom Visuals Ideas
- Issues
- Issues
- Events
- Upcoming Events
Be one of the first to start using Fabric Databases. View on-demand sessions with database experts and the Microsoft product team to learn just how easy it is to get started. Watch now
- Power BI forums
- Forums
- Get Help with Power BI
- Desktop
- Re: Return blank value on DATEDIFF calculated colu...
- Subscribe to RSS Feed
- Mark Topic as New
- Mark Topic as Read
- Float this Topic for Current User
- Bookmark
- Subscribe
- Printer Friendly Page
- Mark as New
- Bookmark
- Subscribe
- Mute
- Subscribe to RSS Feed
- Permalink
- Report Inappropriate Content
Return blank value on DATEDIFF calculated column
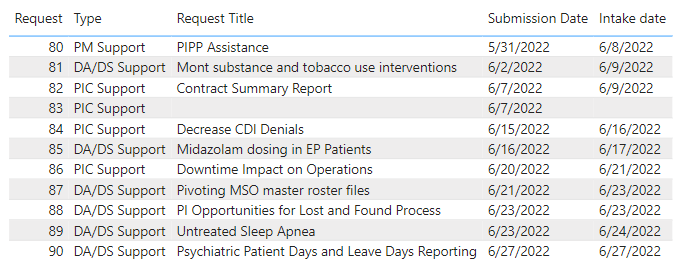
HI. I have a few date columns in my fact table - request submission date, intake date, and review date. Using DATEDIFF I am calculating days to intake and days to review. When a request lacks an intake date and/or review date, that request doesn't show up in my table visualization. How can I show all requests regardless of whether they have data in my calculated Days to Intake column?
Sample data
| Request | Type | Request Title | Submission Date | Intake date |
| 80 | PM Support | PIPP Assistance | 5/31/2022 10:45 | 6/8/2022 0:00 |
| 81 | DA/DS Support | Mont substance and tobacco use interventions | 6/2/2022 13:01 | 6/9/2022 0:00 |
| 82 | PIC Support | Contract Summary Report | 6/7/2022 12:12 | 6/9/2022 0:00 |
| 83 | PIC Support | 6/7/2022 13:59 | ||
| 84 | PIC Support | Decrease CDI Denials | 6/15/2022 6:25 | 6/16/2022 0:00 |
| 85 | DA/DS Support | Midazolam dosing in EP Patients | 6/16/2022 11:45 | 6/17/2022 0:00 |
| 86 | PIC Support | Downtime Impact on Operations | 6/20/2022 6:23 | 6/21/2022 0:00 |
| 87 | DA/DS Support | Pivoting MSO master roster files | 6/21/2022 12:21 | 6/23/2022 0:00 |
| 88 | DA/DS Support | PI Opportunities for Lost and Found Process | 6/23/2022 8:58 | 6/23/2022 0:00 |
DAX for Days to Intake calculated column
Days to Intake = DATEDIFF(Requests[Submission Date],Requests[Intake date],DAY)
Here is what a table visualiztion looks like without including Days to Intake
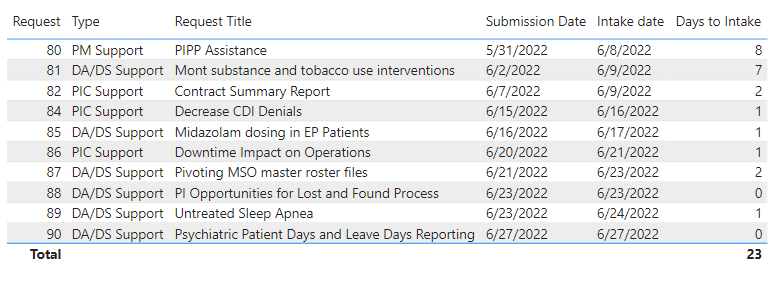
When I add Days to Intake, Request #83 disappears:
I did try to adjust the DAX for the calculated column but that didn't help.
Days to Intake2 =
IF(
    NOT(ISBLANK(Requests[Intake date])),
    DATEDIFF(Requests[Submission Date],Requests[Intake date],DAY),
    BLANK()
)
So, is there a setting in the visualization I can use to show such rows or is there some way I should adjust my DAX or something else? Any help would be greatly appreciated!
Solved! Go to Solution.
- Mark as New
- Bookmark
- Subscribe
- Mute
- Subscribe to RSS Feed
- Permalink
- Report Inappropriate Content
@cathoms when you are using this calculated column in the visual, can you make sure it is not getting aggregated. Maybe the aggregation is changed to sum and for that reason the column with the blank value is not showing up.
Subscribe to the @PowerBIHowTo YT channel for an upcoming video on List and Record functions in Power Query!!
Learn Power BI and Fabric - subscribe to our YT channel - Click here: @PowerBIHowTo
If my solution proved useful, I'd be delighted to receive Kudos. When you put effort into asking a question, it's equally thoughtful to acknowledge and give Kudos to the individual who helped you solve the problem. It's a small gesture that shows appreciation and encouragement! ❤
Did I answer your question? Mark my post as a solution. Proud to be a Super User! Appreciate your Kudos 🙂
Feel free to email me with any of your BI needs.
- Mark as New
- Bookmark
- Subscribe
- Mute
- Subscribe to RSS Feed
- Permalink
- Report Inappropriate Content
@cathoms , I have found an even easier way to achieve what you want, with no change to your existing measure. In the table visual, in the Values section, right-click on the Request field and select "Show Items With No Data". When you do that, the row for Request 83 will appear.
More information here
Show items with no data in Power BI - Power BI | Microsoft Docs
- Mark as New
- Bookmark
- Subscribe
- Mute
- Subscribe to RSS Feed
- Permalink
- Report Inappropriate Content
@cathoms you are the missing the fundamentals here, reason show items with no data worked because the column was getting aggregated (implicit measures) since there is no aggregation required there is no use of show items with no data
✨ Follow us on LinkedIn and  to our YouTube channel
I would ❤ Kudos if my solution helped. 👉 If you can spend time posting the question, you can also make efforts to give Kudos to whoever helped to solve your problem. It is a token of appreciation!
⚡ Visit us at https://perytus.com, your one-stop shop for Power BI-related projects/training/consultancy.
Subscribe to the @PowerBIHowTo YT channel for an upcoming video on List and Record functions in Power Query!!
Learn Power BI and Fabric - subscribe to our YT channel - Click here: @PowerBIHowTo
If my solution proved useful, I'd be delighted to receive Kudos. When you put effort into asking a question, it's equally thoughtful to acknowledge and give Kudos to the individual who helped you solve the problem. It's a small gesture that shows appreciation and encouragement! ❤
Did I answer your question? Mark my post as a solution. Proud to be a Super User! Appreciate your Kudos 🙂
Feel free to email me with any of your BI needs.
- Mark as New
- Bookmark
- Subscribe
- Mute
- Subscribe to RSS Feed
- Permalink
- Report Inappropriate Content
Thanks @parry2k. I didn't mention this in my OP but I think I do need the aggregation in order to show the average Days to Intake or Days to Reivew for my value totals, like this:
- Mark as New
- Bookmark
- Subscribe
- Mute
- Subscribe to RSS Feed
- Permalink
- Report Inappropriate Content
Thanks to both @parry2k and @Anonymous !
Days to Intake was aggregating so checking "don't summarize" worked. I also tested the "show items with no data" and that worked as well.
- Mark as New
- Bookmark
- Subscribe
- Mute
- Subscribe to RSS Feed
- Permalink
- Report Inappropriate Content
@Anonymous sorry but not sure if your answers are addressing the issue, @cathoms is adding datediff as a column not a measure.
Subscribe to the @PowerBIHowTo YT channel for an upcoming video on List and Record functions in Power Query!!
Learn Power BI and Fabric - subscribe to our YT channel - Click here: @PowerBIHowTo
If my solution proved useful, I'd be delighted to receive Kudos. When you put effort into asking a question, it's equally thoughtful to acknowledge and give Kudos to the individual who helped you solve the problem. It's a small gesture that shows appreciation and encouragement! ❤
Did I answer your question? Mark my post as a solution. Proud to be a Super User! Appreciate your Kudos 🙂
Feel free to email me with any of your BI needs.
- Mark as New
- Bookmark
- Subscribe
- Mute
- Subscribe to RSS Feed
- Permalink
- Report Inappropriate Content
@cathoms , I have found an even easier way to achieve what you want, with no change to your existing measure. In the table visual, in the Values section, right-click on the Request field and select "Show Items With No Data". When you do that, the row for Request 83 will appear.
More information here
Show items with no data in Power BI - Power BI | Microsoft Docs
- Mark as New
- Bookmark
- Subscribe
- Mute
- Subscribe to RSS Feed
- Permalink
- Report Inappropriate Content
@cathoms , you can create a measure that still returns a value if the IntakeDate is blank, like this.
Days to Intake =
    SWITCH(true()
        ,ISBLANK(SELECTEDVALUE('YourTable'[Intake date])), ""
        ,DATEDIFF(
            SELECTEDVALUE('YourTable'[Submission Date])
            ,SELECTEDVALUE('YourTable'[Intake date])
            ,DAY
        )
    )
This gives me these results:
- Mark as New
- Bookmark
- Subscribe
- Mute
- Subscribe to RSS Feed
- Permalink
- Report Inappropriate Content
@cathoms when you are using this calculated column in the visual, can you make sure it is not getting aggregated. Maybe the aggregation is changed to sum and for that reason the column with the blank value is not showing up.
Subscribe to the @PowerBIHowTo YT channel for an upcoming video on List and Record functions in Power Query!!
Learn Power BI and Fabric - subscribe to our YT channel - Click here: @PowerBIHowTo
If my solution proved useful, I'd be delighted to receive Kudos. When you put effort into asking a question, it's equally thoughtful to acknowledge and give Kudos to the individual who helped you solve the problem. It's a small gesture that shows appreciation and encouragement! ❤
Did I answer your question? Mark my post as a solution. Proud to be a Super User! Appreciate your Kudos 🙂
Feel free to email me with any of your BI needs.
Helpful resources

Join us at the Microsoft Fabric Community Conference
March 31 - April 2, 2025, in Las Vegas, Nevada. Use code MSCUST for a $150 discount!

Microsoft Fabric Community Conference 2025
Arun Ulag shares exciting details about the Microsoft Fabric Conference 2025, which will be held in Las Vegas, NV.

| User | Count |
|---|---|
| 123 | |
| 80 | |
| 59 | |
| 58 | |
| 44 |
| User | Count |
|---|---|
| 182 | |
| 119 | |
| 82 | |
| 68 | |
| 53 |


