- Power BI forums
- Updates
- News & Announcements
- Get Help with Power BI
- Desktop
- Service
- Report Server
- Power Query
- Mobile Apps
- Developer
- DAX Commands and Tips
- Custom Visuals Development Discussion
- Health and Life Sciences
- Power BI Spanish forums
- Translated Spanish Desktop
- Power Platform Integration - Better Together!
- Power Platform Integrations (Read-only)
- Power Platform and Dynamics 365 Integrations (Read-only)
- Training and Consulting
- Instructor Led Training
- Dashboard in a Day for Women, by Women
- Galleries
- Community Connections & How-To Videos
- COVID-19 Data Stories Gallery
- Themes Gallery
- Data Stories Gallery
- R Script Showcase
- Webinars and Video Gallery
- Quick Measures Gallery
- 2021 MSBizAppsSummit Gallery
- 2020 MSBizAppsSummit Gallery
- 2019 MSBizAppsSummit Gallery
- Events
- Ideas
- Custom Visuals Ideas
- Issues
- Issues
- Events
- Upcoming Events
- Community Blog
- Power BI Community Blog
- Custom Visuals Community Blog
- Community Support
- Community Accounts & Registration
- Using the Community
- Community Feedback
Register now to learn Fabric in free live sessions led by the best Microsoft experts. From Apr 16 to May 9, in English and Spanish.
- Power BI forums
- Forums
- Get Help with Power BI
- Desktop
- Re: Remove top 20 percent and Average Out remainin...
- Subscribe to RSS Feed
- Mark Topic as New
- Mark Topic as Read
- Float this Topic for Current User
- Bookmark
- Subscribe
- Printer Friendly Page
- Mark as New
- Bookmark
- Subscribe
- Mute
- Subscribe to RSS Feed
- Permalink
- Report Inappropriate Content
Remove top 20 percent and Average Out remaining result
Happy Monday everyone!
I would like to know how to write a measure to remove the top 20% of data from a given column and then use the Average function for the remaining value. There will be blank cells that I want to exclude.
See Example below: There are total of 22 rows, 2 of which has no value (blank). I want to remove the top 20% from the 20 rows with values, in this case, 50 and 49, then calculate the average for the remaining rows which should be 16.83 for the remaining 18 rows.
| Project | Value |
| A | 50 |
| B | 49 |
| C | 48 |
| R | 40 |
| P | 35 |
| Q | 32 |
| O | 30 |
| T | 22 |
| N | 20 |
| M | 16 |
| D | 15 |
| E | 10 |
| G | 6 |
| S | 6 |
| F | 5 |
| I | 5 |
| K | 5 |
| H | 4 |
| J | 2 |
| L | 2 |
| U | |
| V |
- Mark as New
- Bookmark
- Subscribe
- Mute
- Subscribe to RSS Feed
- Permalink
- Report Inappropriate Content
Hi @punksterz626 ,
Here are the steps you can follow:
1. Create calculated column.
the top 20% =
COUNTROWS('Table') * 0.2
ranx =
var _count=COUNTX(FILTER(ALL('Table'),'Table'[Value]=BLANK()),[Project])
return
IF(
[Value]=BLANK(),BLANK(),RANKX(ALL('Table'),'Table'[Value],,DESC,Skip)+_count)2. Create measure.
Avg =
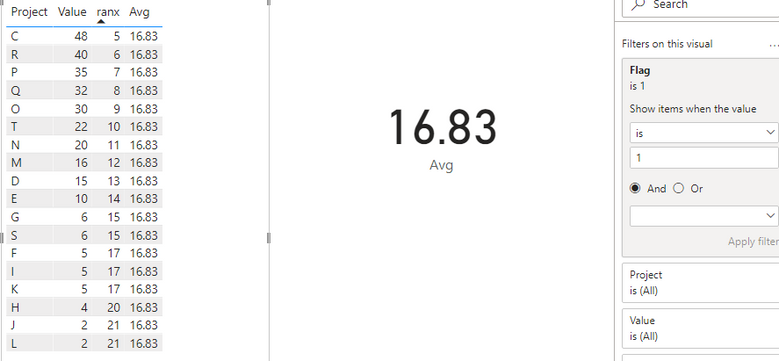
AVERAGEX(FILTER(ALL('Table'),'Table'[ranx]>[the top 20%]),[Value])
Flag =
IF(
MAX('Table'[ranx])>MAX('Table'[the top 20%]),1,0)3. Place [Flag]in Filters, set is=1, apply filter.
4. Result:
Best Regards,
Liu Yang
If this post helps, then please consider Accept it as the solution to help the other members find it more quickly
- Mark as New
- Bookmark
- Subscribe
- Mute
- Subscribe to RSS Feed
- Permalink
- Report Inappropriate Content
That you sir I will review the suggested measures and report back.
- Mark as New
- Bookmark
- Subscribe
- Mute
- Subscribe to RSS Feed
- Permalink
- Report Inappropriate Content
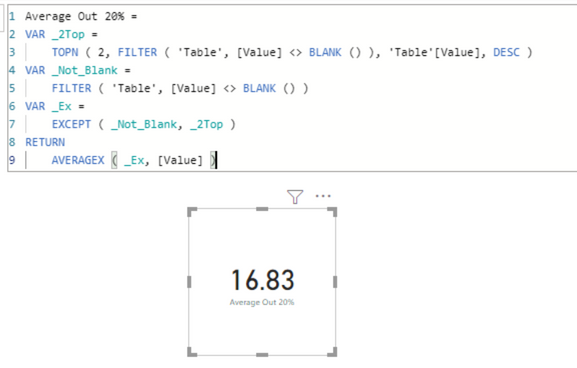
Try this measure:
Average Out 20% =
VAR _2Top =
    TOPN ( 2, FILTER ( 'Table', [Value] <> BLANK () ), 'Table'[Value], DESC )
VAR _Not_Blank =
    FILTER ( 'Table', [Value] <> BLANK () )
VAR _Ex =
    EXCEPT ( _Not_Blank, _2Top )
RETURN
    AVERAGEX ( _Ex, [Value] )
output:
If this post helps, please consider accepting it as the solution to help the other members find it more quickly.
Appreciate your Kudos!!
LinkedIn: www.linkedin.com/in/vahid-dm/
- Mark as New
- Bookmark
- Subscribe
- Mute
- Subscribe to RSS Feed
- Permalink
- Report Inappropriate Content
Hello,
Is it possible to further develop this measure to remove top 20% and bottom 20% and then do average on the rest of values?
- Mark as New
- Bookmark
- Subscribe
- Mute
- Subscribe to RSS Feed
- Permalink
- Report Inappropriate Content
what does this VAR means? It looks like top 2 number? What if my dataset is larger? The one provided is just a sample for simplicity.
VAR _2Top =
    TOPN ( 2, FILTER ( 'Table', [Value] <> BLANK () ), 'Table'[Value], DESC )
- Mark as New
- Bookmark
- Subscribe
- Mute
- Subscribe to RSS Feed
- Permalink
- Report Inappropriate Content
If you want to remove top 20% then in your main question you need to remove 4 top items (20%*20), but you mentioned 2 top items (can you please clear this)
for calculating the top 20% number, try this:
Average Out 20% =
Var _20PerNo =
    ROUND( COUNTROWS( FILTER ( 'Table', [Value] <> BLANK () ))*0.2 , 0 )
VAR _2Top =
    TOPN ( _20PerNo, FILTER ( 'Table', [Value] <> BLANK () ), 'Table'[Value], DESC )
VAR _Not_Blank =
    FILTER ( 'Table', [Value] <> BLANK () )
VAR _Ex =
    EXCEPT ( _Not_Blank, _2Top )
RETURN
    AVERAGEX ( _Ex, [Value] )
If this post helps, please consider accepting it as the solution to help the other members find it more quickly.
Appreciate your Kudos!!
LinkedIn: www.linkedin.com/in/vahid-dm/
- Mark as New
- Bookmark
- Subscribe
- Mute
- Subscribe to RSS Feed
- Permalink
- Report Inappropriate Content
The measure works; however, while playing with the formula I realized there are two additional columns that can alter this formula which i forgot to include. Although i can put a filter on the visual to achieve the final result, I was wondering if it is possible to include it in the measure.
AB_Date =Blank
Status =COMP
The result should be 13.43 (after removing top 20% on value column)
| Project | Value | AB_Date | Status |
| A | 50 | COMP | |
| B | 49 | COMP | |
| C | 48 | COMP | |
| R | 40 | COMP | |
| P | 35 | COMP | |
| Q | 32 | COMP | |
| O | 30 | COMP | |
| T | 22 | COMP | |
| N | 20 | COMP | |
| M | 16 | COMP | |
| D | 15 | COMP | |
| E | 10 | COMP | |
| G | 6 | COMP | |
| S | 6 | COMP | |
| F | 5 | COMP | |
| I | 5 | COMP | |
| K | 5 | COMP | |
| H | 4 | COMP | |
| J | 2 | COMP | |
| L | 2 | COMP | |
| U | 1/21/2022 | NOTCOM | |
| V | 1 | 1/23/2022 | OUT |
- Mark as New
- Bookmark
- Subscribe
- Mute
- Subscribe to RSS Feed
- Permalink
- Report Inappropriate Content
Apparently, my math is just as bad as my DAX. You are correct, should be top 4. I will review the suggested measures and report back. Thank you so very much!
Helpful resources

Microsoft Fabric Learn Together
Covering the world! 9:00-10:30 AM Sydney, 4:00-5:30 PM CET (Paris/Berlin), 7:00-8:30 PM Mexico City

Power BI Monthly Update - April 2024
Check out the April 2024 Power BI update to learn about new features.

| User | Count |
|---|---|
| 109 | |
| 99 | |
| 83 | |
| 76 | |
| 65 |
| User | Count |
|---|---|
| 120 | |
| 111 | |
| 94 | |
| 83 | |
| 77 |


