cancel
Showing results for 
Search instead for 
Did you mean: 

July 7 - July 17 | Round 2 of the Power BI Dataviz World Championships. Don't miss your chance! Learn more

Reply
Anonymous
Not applicable

Quick Measure Help - Sum-If function in PowerBI

Hello,


I'd like some help with a calculated (or a few?) field please. I have a simplified sample of the kind of data I'm looking at below. I have a list of branches, qty shipped on a date, and if the shipment was successful. What I'd like to do is basically Sum sucessful  (Y) shipment qty per branch / total shipment qty per branch (all Y + N shipments). 


In antoher vizualization, I'd like to do successful shipments (count of Y) per branch / count of shipments per branch (Y + N).


Branch

Ship QTYSuccess Ship?Date
404645Y1/15/2020
404620Y2/19/2020
45823N8/15/2020
458548Y9/12/2020

550

678Y11/4/2020
5502Y3/10/2020
84021N4/18/2020
840900N7/10/2020


The obejective is to get a chart that will show which branches have the highest % successful shipments, and which branches have the lowest % successful shipments. Actual data set has 10k+ rows with 110 different branches. 


Is this two separate calcluated fields? I've tried multiple ways to solve this but can't figure this out. 


Thanks in advance,

Harris 

1 ACCEPTED SOLUTION
Anonymous
Not applicable

Hi @Anonymous ,


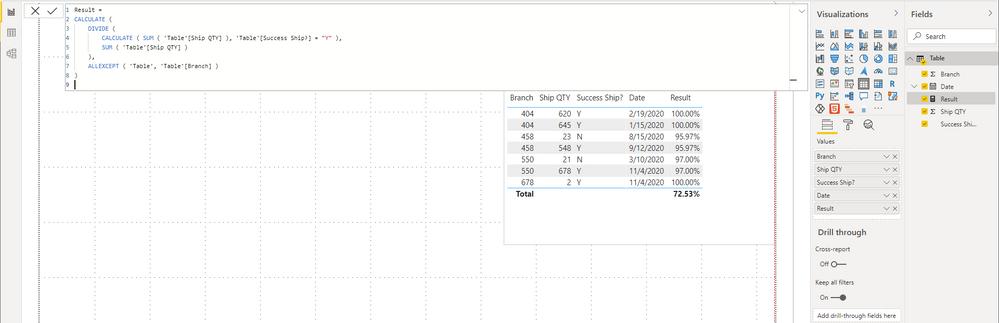
You don't need to use quick measure, just create a measure directly.

Try this measure

Result =
CALCULATE (
    DIVIDE (
        CALCULATE ( SUM ( 'Table'[Ship QTY] ), 'Table'[Success Ship?] = "Y" ),
        SUM ( 'Table'[Ship QTY] )
    ),
    ALLEXCEPT ( 'Table', 'Table'[Branch] )
)

Screenshot 2021-04-13 155353.png


Best Regards,

Stephen Tao


If this post helps, then please consider Accept it as the solution to help the other members find it more quickly.

View solution in original post

4 REPLIES 4
Anonymous
Not applicable

Hi @Anonymous ,


You don't need to use quick measure, just create a measure directly.

Try this measure

Result =
CALCULATE (
    DIVIDE (
        CALCULATE ( SUM ( 'Table'[Ship QTY] ), 'Table'[Success Ship?] = "Y" ),
        SUM ( 'Table'[Ship QTY] )
    ),
    ALLEXCEPT ( 'Table', 'Table'[Branch] )
)

Screenshot 2021-04-13 155353.png


Best Regards,

Stephen Tao


If this post helps, then please consider Accept it as the solution to help the other members find it more quickly.

amitchandak
Super User
Super User

@Anonymous , You can use TOPN and Rank

In the case of TOPN, you can add both top and bottom rank in measure


Refer my video for TOPN -https://www.youtube.com/watch?v=QIVEFp-QiOk

or

For Rank Refer these links
https://radacad.com/how-to-use-rankx-in-dax-part-2-of-3-calculated-measures

Share with Power BI Enthusiasts: Full Power BI Video (20 Hours) YouTube
Microsoft Fabric Series 60+ Videos YouTube
Microsoft Fabric Hindi End to End YouTube
Anonymous
Not applicable

Hello,


This wasn't really enough information. I understand how to rank and only show the top 10 values, but I need to calculate If Branch X, (Sum of Y) / (Sum of Y + N). Can you help to solve this? 


Maybe it needs to be another table?


Thanks for your help. 

@Anonymous , when you have not selected Success Ship in visual 

Try measure  

sum(calculate(sum(Table[Ship QTY]), filter(Table, Table[Success Ship] ="Y")), sum(Table[Ship QTY]))


if Success Ship is in visual 

Try a measure = 
sum(sum(Table[Ship QTY]),calculate(sum(Table[Ship QTY]), removefilters(Table[Success Ship])))

Share with Power BI Enthusiasts: Full Power BI Video (20 Hours) YouTube
Microsoft Fabric Series 60+ Videos YouTube
Microsoft Fabric Hindi End to End YouTube

Helpful resources

Announcements
FabCon and SQLCon Barcelona 2026

FabCon & SQLCon – Barcelona 2026

Join us in Barcelona for FabCon and SQLCon, the Fabric, Power BI, SQL, and AI community event. Save €200 with code FABCMTY200.

60 days of Data Days Carousel

Data Days 2026

Join Data Days 2026: 60 days of free live/on-demand sessions, challenges, study groups, and certification opportunities.

Power BI DataViz World Championships carousel

Power BI DataViz World Championships - June 2026

A new Power BI DataViz World Championship is coming this June! Don't miss out on submitting your entry.

Top Solution Authors