Join us at FabCon Vienna from September 15-18, 2025
The ultimate Fabric, Power BI, SQL, and AI community-led learning event. Save €200 with code FABCOMM.
Get registered- Power BI forums
- Get Help with Power BI
- Desktop
- Service
- Report Server
- Power Query
- Mobile Apps
- Developer
- DAX Commands and Tips
- Custom Visuals Development Discussion
- Health and Life Sciences
- Power BI Spanish forums
- Translated Spanish Desktop
- Training and Consulting
- Instructor Led Training
- Dashboard in a Day for Women, by Women
- Galleries
- Data Stories Gallery
- Themes Gallery
- Contests Gallery
- Quick Measures Gallery
- Notebook Gallery
- Translytical Task Flow Gallery
- TMDL Gallery
- R Script Showcase
- Webinars and Video Gallery
- Ideas
- Custom Visuals Ideas (read-only)
- Issues
- Issues
- Events
- Upcoming Events
Compete to become Power BI Data Viz World Champion! First round ends August 18th. Get started.
- Power BI forums
- Forums
- Get Help with Power BI
- Desktop
- Re: PowerBI Map View Filtered along side with Unfi...
- Subscribe to RSS Feed
- Mark Topic as New
- Mark Topic as Read
- Float this Topic for Current User
- Bookmark
- Subscribe
- Printer Friendly Page

- Mark as New
- Bookmark
- Subscribe
- Mute
- Subscribe to RSS Feed
- Permalink
- Report Inappropriate Content
PowerBI Map View Filtered along side with Unfiltred Data
Hello Everyone
I'm struggling with this I don't know how to achieve it.
So Basically I have a map with bubbles in it
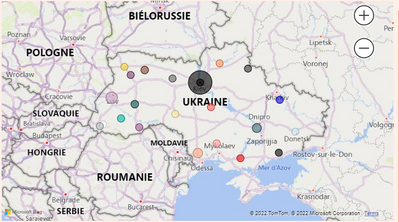
Everything Normal at this point.
What I need to do is when I filter using any of my slicers, I need the map to highlight the filtered data but also to show the other bubbles.
(Screenshot below is when I apply a slicer filter) the map is also filtered and only one bubble remains, I want the others to stay even the same way when I click on a bubble on the map. ( Second screenshot bellow)
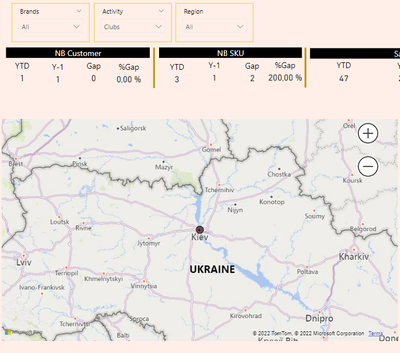

Any help will be appreciated, thanks in advance.
Solved! Go to Solution.

- Mark as New
- Bookmark
- Subscribe
- Mute
- Subscribe to RSS Feed
- Permalink
- Report Inappropriate Content
Hi @AmineGatou ,
You will need to create an indenpenet slicer table like below:
slicer = distinct('table'[locations])
Then create a measure like below and add it to conditional formatting value.
https://docs.microsoft.com/en-us/power-bi/create-reports/desktop-conditional-table-formatting
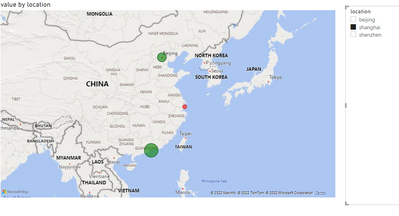

Best Regards,
Jay
- Mark as New
- Bookmark
- Subscribe
- Mute
- Subscribe to RSS Feed
- Permalink
- Report Inappropriate Content
Hi @AmineGatou ,
If you have other slicers, add the filter conditions to the measure.
Measure = IF(SELECTEDVALUE('Table'[location]) in VALUES('slicer'[location]&&'table'[column] in Values('slicer2'[column])),"red","green")
Best Regards,
Jay
- Mark as New
- Bookmark
- Subscribe
- Mute
- Subscribe to RSS Feed
- Permalink
- Report Inappropriate Content
Hi @AmineGatou ,
You will need to create an indenpenet slicer table like below:
slicer = distinct('table'[locations])
Then create a measure like below and add it to conditional formatting value.
https://docs.microsoft.com/en-us/power-bi/create-reports/desktop-conditional-table-formatting
Best Regards,
Jay
- Mark as New
- Bookmark
- Subscribe
- Mute
- Subscribe to RSS Feed
- Permalink
- Report Inappropriate Content
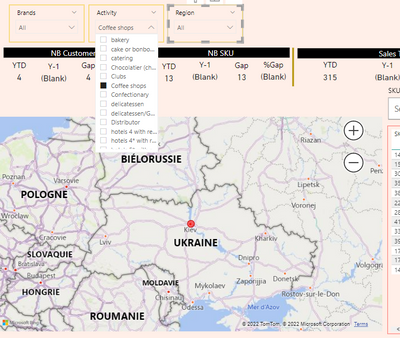
Great! It works but with the location slicer only !
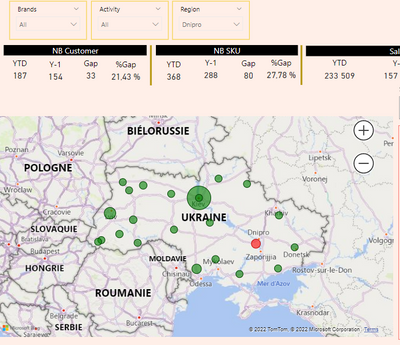
But if I use another slicer it won't work at all.
- Mark as New
- Bookmark
- Subscribe
- Mute
- Subscribe to RSS Feed
- Permalink
- Report Inappropriate Content
Hi @AmineGatou ,
If you have other slicers, add the filter conditions to the measure.
Measure = IF(SELECTEDVALUE('Table'[location]) in VALUES('slicer'[location]&&'table'[column] in Values('slicer2'[column])),"red","green")
Best Regards,
Jay
- Mark as New
- Bookmark
- Subscribe
- Mute
- Subscribe to RSS Feed
- Permalink
- Report Inappropriate Content
What should i do when my location are the longitudes and latitudes its not a single value


- Mark as New
- Bookmark
- Subscribe
- Mute
- Subscribe to RSS Feed
- Permalink
- Report Inappropriate Content
there are several maps in power bi, which one are you using? also what you have plotted, please provie more information.
If I took the time to answer your question and I came up with a solution, please mark my post as a solution and /or give kudos freely for the effort 🙂 Thank you!
Proud to be a Super User!
- Mark as New
- Bookmark
- Subscribe
- Mute
- Subscribe to RSS Feed
- Permalink
- Report Inappropriate Content
Hello, The map type used is just the regular map of powerbi
and i'm plotting the sales Measure depending on regions!
- Mark as New
- Bookmark
- Subscribe
- Mute
- Subscribe to RSS Feed
- Permalink
- Report Inappropriate Content
there is no regular one, which one are you using, in order for help to be given, you need to give the details.
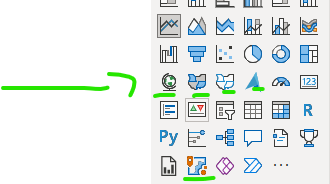
If I took the time to answer your question and I came up with a solution, please mark my post as a solution and /or give kudos freely for the effort 🙂 Thank you!
Proud to be a Super User!
- Mark as New
- Bookmark
- Subscribe
- Mute
- Subscribe to RSS Feed
- Permalink
- Report Inappropriate Content
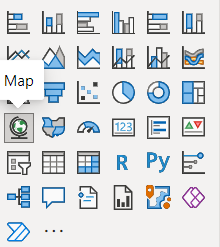
Here is the one used
- Mark as New
- Bookmark
- Subscribe
- Mute
- Subscribe to RSS Feed
- Permalink
- Report Inappropriate Content
you need to probably change your edit interactions and set it to the no filter

once you have selected edit interactions, there will be some filters show top right of every object, then click on the slicer object first, then on your map select no filter
ie
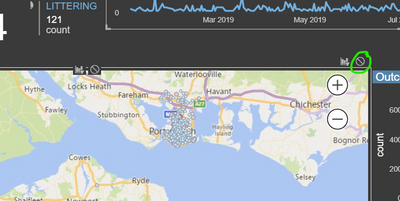
more information here
https://docs.microsoft.com/en-us/power-bi/create-reports/service-reports-visual-interactions
If I took the time to answer your question and I came up with a solution, please mark my post as a solution and /or give kudos freely for the effort 🙂 Thank you!
Proud to be a Super User!
- Mark as New
- Bookmark
- Subscribe
- Mute
- Subscribe to RSS Feed
- Permalink
- Report Inappropriate Content
This does help but it isn't what I'm looking for.
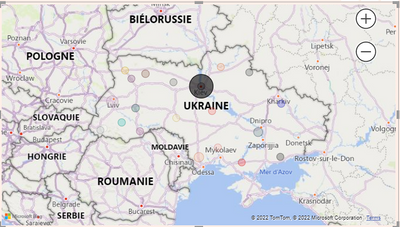
What I mean is that I want my map to be filtered but just to grey out the unfiltered data just like this .
- Mark as New
- Bookmark
- Subscribe
- Mute
- Subscribe to RSS Feed
- Permalink
- Report Inappropriate Content
Hello did you get the solution ? because i have the same problem here
- Mark as New
- Bookmark
- Subscribe
- Mute
- Subscribe to RSS Feed
- Permalink
- Report Inappropriate Content
Unfortunately, i couldn't find a solution to it. Still waiting.
Helpful resources

Power BI Monthly Update - August 2025
Check out the August 2025 Power BI update to learn about new features.

Fabric Community Update - August 2025
Find out what's new and trending in the Fabric community.


| User | Count |
|---|---|
| 78 | |
| 70 | |
| 68 | |
| 64 | |
| 42 |


