Hi @Anonymous,
This is easy to do with DAX. But if you'd like the Power Query solution, please refer to the following steps.
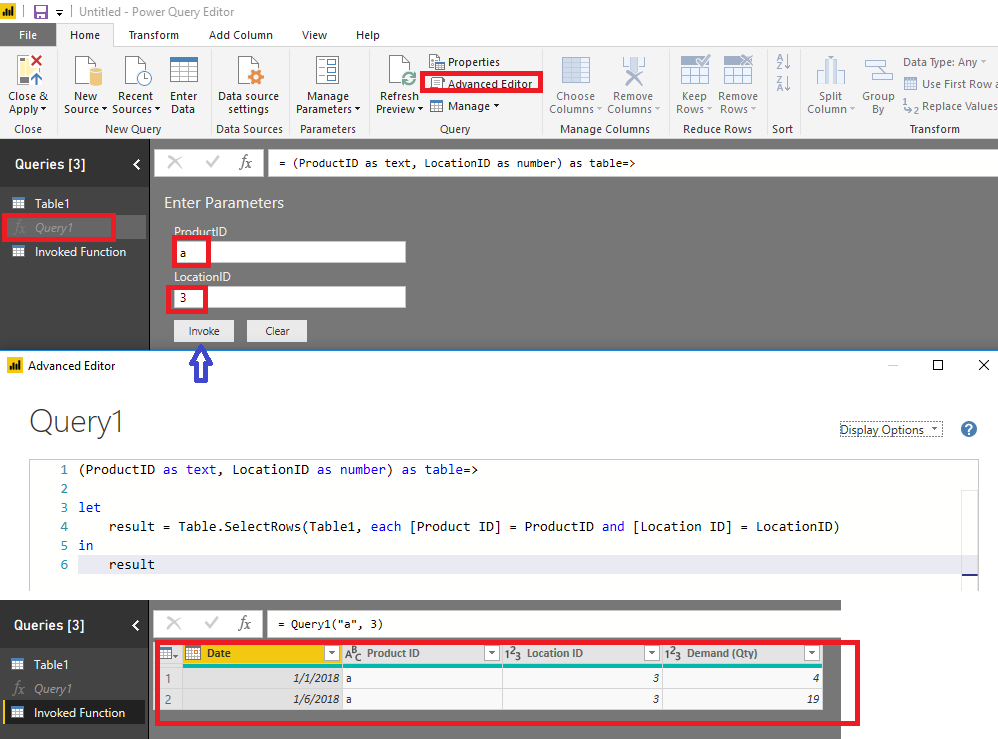
1. Create a function.
(ProductID as text, LocationID as number) as table=>

let
    result = Table.SelectRows(Table1, each [Product ID] = ProductID and [Location ID] = LocationID)
in
    result
2. Invoke the function with parameters.
Please download the demo in the attachment.
Best Regards,
Dale
Community Support Team _ Dale
If this post helps, then please consider Accept it as the solution to help the other members find it more quickly.

