Join us at the 2025 Microsoft Fabric Community Conference
Microsoft Fabric Community Conference 2025, March 31 - April 2, Las Vegas, Nevada. Use code MSCUST for a $150 discount.
Register now- Power BI forums
- Get Help with Power BI
- Desktop
- Service
- Report Server
- Power Query
- Mobile Apps
- Developer
- DAX Commands and Tips
- Custom Visuals Development Discussion
- Health and Life Sciences
- Power BI Spanish forums
- Translated Spanish Desktop
- Training and Consulting
- Instructor Led Training
- Dashboard in a Day for Women, by Women
- Galleries
- Webinars and Video Gallery
- Data Stories Gallery
- Themes Gallery
- Contests Gallery
- Quick Measures Gallery
- R Script Showcase
- COVID-19 Data Stories Gallery
- Community Connections & How-To Videos
- 2021 MSBizAppsSummit Gallery
- 2020 MSBizAppsSummit Gallery
- 2019 MSBizAppsSummit Gallery
- Events
- Ideas
- Custom Visuals Ideas
- Issues
- Issues
- Events
- Upcoming Events
The Power BI DataViz World Championships are on! With four chances to enter, you could win a spot in the LIVE Grand Finale in Las Vegas. Show off your skills.
- Power BI forums
- Forums
- Get Help with Power BI
- Desktop
- Re: Power KPI Matrix measure format disapears
- Subscribe to RSS Feed
- Mark Topic as New
- Mark Topic as Read
- Float this Topic for Current User
- Bookmark
- Subscribe
- Printer Friendly Page
- Mark as New
- Bookmark
- Subscribe
- Mute
- Subscribe to RSS Feed
- Permalink
- Report Inappropriate Content
Power KPI Matrix measure format disapears
Hi,
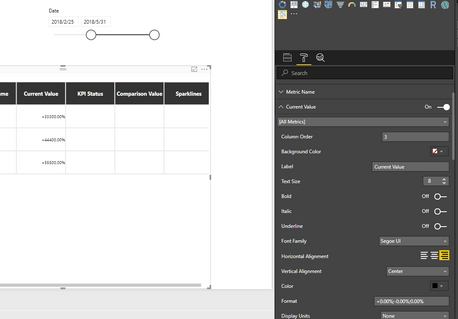
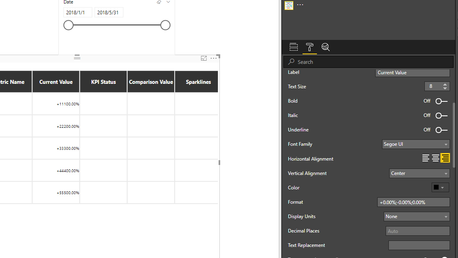
I'm facing a problem when using the Power KPI Matrix Visual: When I customize the format of a measure (for ex to percentage), the formating disapears (goes back to the default) when I change the filter of the start date.
For example, see https://1drv.ms/f/s!AlxsluYfTeFTgWvvsqoczNg0NWzL
- Example 1: when using the default settings of the date filter, it works fine
- Example 2: when changing the date filter, the format goes back on the default (only if I change the start date, it works when i change the end date...)
Please help!
Thanks,
Dimitri
- Mark as New
- Bookmark
- Subscribe
- Mute
- Subscribe to RSS Feed
- Permalink
- Report Inappropriate Content
This still hasn't been resolved. Very frustrating.
- Mark as New
- Bookmark
- Subscribe
- Mute
- Subscribe to RSS Feed
- Permalink
- Report Inappropriate Content
Hi Dimi123,
I have tested on your issue but can't reproduce it. Could you please provide your dummy data or PBIX file for further test?


Best Regards,
Jimmy Tao
- Mark as New
- Bookmark
- Subscribe
- Mute
- Subscribe to RSS Feed
- Permalink
- Report Inappropriate Content
Hi,
I guess it happens when you use different kinds of formatting for different measures: I have one measure in € and one in %.
If you change the startdate, then the formatting disapears.
see sample pbix: https://1drv.ms/u/s!AlxsluYfTeFTgW1YgjGTOOowRfiB
Best regards,
Dimitri
- Mark as New
- Bookmark
- Subscribe
- Mute
- Subscribe to RSS Feed
- Permalink
- Report Inappropriate Content
Hello there
Has this been resolved? I'm getting the same issue whenever a date range is changed.
Different measures with different formats. Which I've set individually for each measure using the format pane.
#,0 for a number and 0.0% for %
- Mark as New
- Bookmark
- Subscribe
- Mute
- Subscribe to RSS Feed
- Permalink
- Report Inappropriate Content
No, until now there is no solution..
- Mark as New
- Bookmark
- Subscribe
- Mute
- Subscribe to RSS Feed
- Permalink
- Report Inappropriate Content
Helpful resources

Join us at the Microsoft Fabric Community Conference
March 31 - April 2, 2025, in Las Vegas, Nevada. Use code MSCUST for a $150 discount!

Join our Community Sticker Challenge 2025
If you love stickers, then you will definitely want to check out our Community Sticker Challenge!

| User | Count |
|---|---|
| 126 | |
| 78 | |
| 78 | |
| 59 | |
| 51 |
| User | Count |
|---|---|
| 165 | |
| 83 | |
| 68 | |
| 68 | |
| 59 |
