FabCon is coming to Atlanta
Join us at FabCon Atlanta from March 16 - 20, 2026, for the ultimate Fabric, Power BI, AI and SQL community-led event. Save $200 with code FABCOMM.
Register now!- Power BI forums
- Get Help with Power BI
- Desktop
- Service
- Report Server
- Power Query
- Mobile Apps
- Developer
- DAX Commands and Tips
- Custom Visuals Development Discussion
- Health and Life Sciences
- Power BI Spanish forums
- Translated Spanish Desktop
- Training and Consulting
- Instructor Led Training
- Dashboard in a Day for Women, by Women
- Galleries
- Data Stories Gallery
- Themes Gallery
- Contests Gallery
- Quick Measures Gallery
- Notebook Gallery
- Translytical Task Flow Gallery
- TMDL Gallery
- R Script Showcase
- Webinars and Video Gallery
- Ideas
- Custom Visuals Ideas (read-only)
- Issues
- Issues
- Events
- Upcoming Events
Calling all Data Engineers! Fabric Data Engineer (Exam DP-700) live sessions are back! Starting October 16th. Sign up.
- Power BI forums
- Forums
- Get Help with Power BI
- Desktop
- Performance Analyzer GUI vs JSON
- Subscribe to RSS Feed
- Mark Topic as New
- Mark Topic as Read
- Float this Topic for Current User
- Bookmark
- Subscribe
- Printer Friendly Page
- Mark as New
- Bookmark
- Subscribe
- Mute
- Subscribe to RSS Feed
- Permalink
- Report Inappropriate Content
Performance Analyzer GUI vs JSON
Dupe post, please go here.
Hi,
I'm trying to understand the Performance Analyzer data exported in JSON.
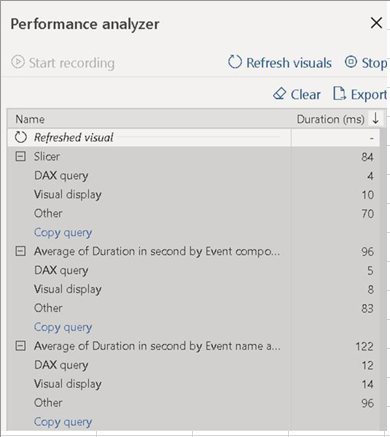
With the GUI, it's quite clear, and the documentation is explaining well:
DAX query - if a DAX query was required, this is the time between the visual sending the query, and for Analysis Services to return the results.Visual display - time required for the visual to draw on the screen, including time required to retrieve any web images or geocoding.Other - time required by the visual for preparing queries, waiting for other visuals to complete, or performing other background processing.
But Once I export the data in JSON, I get different hierachy / category. I think it's something like this:
(from left to right)
and:
After testing and comparing a bit, I guess that the GUI DAX query is equal to the JSON Execute DAX Query and that the GUI Visual display is equal to the JSON Render. I have no clue about the rest ![]()
Am I missing something? Do you have any information about the data exported in JSON and how to link it with the GUI display?
I tried to compare:

With the JSON file exported:
{"version":"1.0.0","events":[{"name":"User Action","component":"Report Canvas","start":"2019-06-26T09:46:42.601Z","id":"ccdc8d42a77262a7c866","metrics":{"sourceLabel":"UserAction_Refresh"}},{"name":"Visual Container Lifecycle","component":"Report Canvas","start":"2019-06-26T09:46:42.605Z","end":"2019-06-26T09:46:42.689Z","id":"4f4ad20c7589b5410055","metrics":{"status":"finished","visualTitle":"Slicer"}},{"name":"Query","component":"Report Canvas","start":"2019-06-26T09:46:42.606Z","end":"2019-06-26T09:46:42.680Z","id":"ddeb60c0055ae5117113","parentId":"4f4ad20c7589b5410055"},{"name":"Render","component":"Report Canvas","start":"2019-06-26T09:46:42.679Z","end":"2019-06-26T09:46:42.689Z","id":"00c7257f7c270570e97a","parentId":"4f4ad20c7589b5410055"},{"name":"Data View Transform","component":"Report Canvas","start":"2019-06-26T09:46:42.683Z","end":"2019-06-26T09:46:42.684Z","id":"3d1f1275c5e60e2387d7","parentId":"00c7257f7c270570e97a"},{"name":"Query Generation","component":"Report Canvas","start":"2019-06-26T09:46:42.618Z","end":"2019-06-26T09:46:42.619Z","id":"aa1ee88180dc08d344d3","parentId":"ddeb60c0055ae5117113"},{"name":"Execute Semantic Query","component":"DSE","start":"2019-06-26T09:46:42.665Z","end":"2019-06-26T09:46:42.672Z","id":"5e13d473-6a2b-452b-9ca8-84c70e7fcdf4","parentId":"ddeb60c0055ae5117113"},{"name":"Execute DAX Query","component":"DSE","start":"2019-06-26T09:46:42.668Z","end":"2019-06-26T09:46:42.672Z","id":"af473852-aa88-4f43-b379-a841b2a8cee9","parentId":"5e13d473-6a2b-452b-9ca8-84c70e7fcdf4","metrics":{"QueryText":"EVALUATE\r\n TOPN(101, VALUES('Sources'[Source file name]), 'Sources'[Source file name], 1)\r\n\r\nORDER BY\r\n 'Sources'[Source file name]","RowCount":8}},{"name":"Execute Query","component":"AS","start":"2019-06-26T09:46:42.670Z","end":"2019-06-26T09:46:42.670Z","id":"D8C45547-7EC0-43A1-B33B-2FABBED74ECC","parentId":"af473852-aa88-4f43-b379-a841b2a8cee9"},{"name":"Serialize Rowset","component":"AS","start":"2019-06-26T09:46:42.670Z","end":"2019-06-26T09:46:42.670Z","id":"A4D76E75-1320-49EC-919A-F9B2624AB3F2","parentId":"D8C45547-7EC0-43A1-B33B-2FABBED74ECC"},{"name":"Visual Container Lifecycle","component":"Report Canvas","start":"2019-06-26T09:46:42.607Z","end":"2019-06-26T09:46:42.702Z","id":"0e637d6ab00791aad5dc","metrics":{"status":"finished","visualTitle":"Average of Duration in second by Event component"}},{"name":"Query","component":"Report Canvas","start":"2019-06-26T09:46:42.607Z","end":"2019-06-26T09:46:42.695Z","id":"d328a2280ea702328479","parentId":"0e637d6ab00791aad5dc"},{"name":"Render","component":"Report Canvas","start":"2019-06-26T09:46:42.694Z","end":"2019-06-26T09:46:42.702Z","id":"463a184031590cbdd81b","parentId":"0e637d6ab00791aad5dc"},{"name":"Data View Transform","component":"Report Canvas","start":"2019-06-26T09:46:42.697Z","end":"2019-06-26T09:46:42.698Z","id":"6a9e1b677c169a6de00b","parentId":"463a184031590cbdd81b"},{"name":"Query Generation","component":"Report Canvas","start":"2019-06-26T09:46:42.619Z","end":"2019-06-26T09:46:42.621Z","id":"8b07662b3a29e8dc6800","parentId":"d328a2280ea702328479"},{"name":"Execute Semantic Query","component":"DSE","start":"2019-06-26T09:46:42.665Z","end":"2019-06-26T09:46:42.673Z","id":"73e37c36-c829-4f02-823b-fb73a2233178","parentId":"d328a2280ea702328479"},{"name":"Execute DAX Query","component":"DSE","start":"2019-06-26T09:46:42.668Z","end":"2019-06-26T09:46:42.673Z","id":"c8d980cf-0e50-447d-855a-43ce4efec94d","parentId":"73e37c36-c829-4f02-823b-fb73a2233178","metrics":{"QueryText":"EVALUATE\r\n TOPN(\r\n 1002,\r\n SUMMARIZECOLUMNS(\r\n 'Attributes'[Event component],\r\n \"AverageDuration_in_second\", CALCULATE(AVERAGE('Attributes'[Duration in second]))\r\n ),\r\n [AverageDuration_in_second],\r\n 0,\r\n 'Attributes'[Event component],\r\n 1\r\n )\r\n\r\nORDER BY\r\n [AverageDuration_in_second] DESC, 'Attributes'[Event component]","RowCount":3}},{"name":"Execute Query","component":"AS","start":"2019-06-26T09:46:42.670Z","end":"2019-06-26T09:46:42.673Z","id":"3F0173F8-E264-4F12-BA89-D5F4970725E7","parentId":"c8d980cf-0e50-447d-855a-43ce4efec94d"},{"name":"Serialize Rowset","component":"AS","start":"2019-06-26T09:46:42.673Z","end":"2019-06-26T09:46:42.673Z","id":"63DEC83B-9498-44C8-AED8-42702CB81A8D","parentId":"3F0173F8-E264-4F12-BA89-D5F4970725E7"},{"name":"Visual Container Lifecycle","component":"Report Canvas","start":"2019-06-26T09:46:42.608Z","end":"2019-06-26T09:46:42.730Z","id":"28f4da8fd13884ebb507","metrics":{"status":"finished","visualTitle":"Average of Duration in second by Event name and Event component"}},{"name":"Query","component":"Report Canvas","start":"2019-06-26T09:46:42.608Z","end":"2019-06-26T09:46:42.716Z","id":"a65d5baf00d59810b06d","parentId":"28f4da8fd13884ebb507"},{"name":"Render","component":"Report Canvas","start":"2019-06-26T09:46:42.716Z","end":"2019-06-26T09:46:42.730Z","id":"36e8a808c4b70040268e","parentId":"28f4da8fd13884ebb507"},{"name":"Data View Transform","component":"Report Canvas","start":"2019-06-26T09:46:42.717Z","end":"2019-06-26T09:46:42.719Z","id":"db8658f0dd3873b18360","parentId":"36e8a808c4b70040268e"},{"name":"Query Generation","component":"Report Canvas","start":"2019-06-26T09:46:42.621Z","end":"2019-06-26T09:46:42.622Z","id":"61a0614382d084817bcd","parentId":"a65d5baf00d59810b06d"},{"name":"Execute Semantic Query","component":"DSE","start":"2019-06-26T09:46:42.665Z","end":"2019-06-26T09:46:42.682Z","id":"79d5cfec-127a-437b-b19e-d96d4f5acf3f","parentId":"a65d5baf00d59810b06d"},{"name":"Execute DAX Query","component":"DSE","start":"2019-06-26T09:46:42.669Z","end":"2019-06-26T09:46:42.681Z","id":"d4ea411c-c68f-4294-aaf6-3be4fa459d03","parentId":"79d5cfec-127a-437b-b19e-d96d4f5acf3f","metrics":{"QueryText":"DEFINE\r\n VAR __DS0Core = \r\n SUMMARIZECOLUMNS(\r\n 'Attributes'[Event name],\r\n ROLLUPADDISSUBTOTAL('Attributes'[Event component], \"IsGrandTotalColumnTotal\"),\r\n \"AverageDuration_in_second\", CALCULATE(AVERAGE('Attributes'[Duration in second]))\r\n )\r\n\r\n VAR __DS0CoreOnlyOutputTotals = \r\n SELECTCOLUMNS(\r\n KEEPFILTERS(FILTER(KEEPFILTERS(__DS0Core), [IsGrandTotalColumnTotal] = FALSE)),\r\n \"'Attributes'[Event name]\", 'Attributes'[Event name],\r\n \"'Attributes'[Event component]\", 'Attributes'[Event component],\r\n \"AverageDuration_in_second\", [AverageDuration_in_second]\r\n )\r\n\r\n VAR __DS0CoreTableByDM0 = \r\n SELECTCOLUMNS(\r\n KEEPFILTERS(FILTER(KEEPFILTERS(__DS0Core), [IsGrandTotalColumnTotal] = TRUE)),\r\n \"'Attributes'[Event name]\", 'Attributes'[Event name],\r\n \"SortBy_DM0_0\", [AverageDuration_in_second]\r\n )\r\n\r\n VAR __DS0PrimaryWithSortColumns = \r\n NATURALLEFTOUTERJOIN(\r\n SUMMARIZE(__DS0Core, 'Attributes'[Event name]),\r\n __DS0CoreTableByDM0\r\n )\r\n\r\n VAR __DS0Primary = \r\n TOPN(201, __DS0PrimaryWithSortColumns, [SortBy_DM0_0], 0, 'Attributes'[Event name], 1)\r\n\r\n VAR __DS0Secondary = \r\n TOPN(\r\n 62,\r\n SUMMARIZE(__DS0CoreOnlyOutputTotals, 'Attributes'[Event component]),\r\n 'Attributes'[Event component],\r\n 1\r\n )\r\n\r\nEVALUATE\r\n __DS0Secondary\r\n\r\nORDER BY\r\n 'Attributes'[Event component]\r\n\r\nEVALUATE\r\n NATURALLEFTOUTERJOIN(\r\n __DS0Primary,\r\n SUBSTITUTEWITHINDEX(\r\n __DS0CoreOnlyOutputTotals,\r\n \"ColumnIndex\",\r\n __DS0Secondary,\r\n 'Attributes'[Event component],\r\n ASC\r\n )\r\n )\r\n\r\nORDER BY\r\n [SortBy_DM0_0] DESC, 'Attributes'[Event name], [ColumnIndex]","RowCount":13}},{"name":"Execute Query","component":"AS","start":"2019-06-26T09:46:42.673Z","end":"2019-06-26T09:46:42.680Z","id":"F2CC4AED-5D83-4F64-9FD1-941B655DE695","parentId":"d4ea411c-c68f-4294-aaf6-3be4fa459d03"},{"name":"Serialize Rowset","component":"AS","start":"2019-06-26T09:46:42.680Z","end":"2019-06-26T09:46:42.680Z","id":"D55C90D9-7B48-4019-9856-2A472DBC0AE7","parentId":"F2CC4AED-5D83-4F64-9FD1-941B655DE695"}]}
Thanks!
Loïs
Solved! Go to Solution.
- Mark as New
- Bookmark
- Subscribe
- Mute
- Subscribe to RSS Feed
- Permalink
- Report Inappropriate Content
Dupe, please go here.
Hi @Anonymous,
Thanks for your reply!
But I still don't clearly understand how (based on the example I provided), we come from:
to:
and also, where to find a definition of Report Canvas/DSE/AS/Visual Container Lifecycle and all others?
Regards,
Loïs
- Mark as New
- Bookmark
- Subscribe
- Mute
- Subscribe to RSS Feed
- Permalink
- Report Inappropriate Content
Hi @Anonymous ,
>>Do you have any information about the data exported in JSON and how to link it with the GUI display?
I think this feature turn on timers to record all expression formula calculation duration, then summary these result and display on analyze panel.
For exported json file, it only means power bi convert these results as json format.(json not support to run and trace expression calculate)
Regards,
Xiaoxin Sheng
- Mark as New
- Bookmark
- Subscribe
- Mute
- Subscribe to RSS Feed
- Permalink
- Report Inappropriate Content
Dupe, please go here.
Hi @Anonymous,
Thanks for your reply!
But I still don't clearly understand how (based on the example I provided), we come from:
to:
and also, where to find a definition of Report Canvas/DSE/AS/Visual Container Lifecycle and all others?
Regards,
Loïs
Helpful resources

FabCon Global Hackathon
Join the Fabric FabCon Global Hackathon—running virtually through Nov 3. Open to all skill levels. $10,000 in prizes!

Power BI Monthly Update - October 2025
Check out the October 2025 Power BI update to learn about new features.

