This time we’re going bigger than ever. Fabric, Power BI, SQL, AI and more. We're covering it all. You won't want to miss it.
Learn moreLevel up your Power BI skills this month - build one visual each week and tell better stories with data! Get started
Hi,
I want to make my part of text bold like the headers of each points. And this text is dynamic so can't use Text Box.
Any help would be appreciated.
Thanks,
Sud
For those that found this question through Google/Bing,
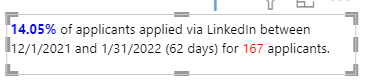
I personally found a workaround by adding the `HTML5 Custom Visual` and creating a measure with HTML syntax.
OKR1_SmartNarrative =
"<span style='color:blue;font-weight: bold'>"
& FORMAT([AppliedViaLinkedIn_%OfTotal], "Percent")
& "</span>"
& " of applicants applied via LinkedIn between "
& FIRSTDATE('Date'[Date])
& " and "
& LASTDATE('Date'[Date])
& " (" & COUNTROWS('Date') & " days)"
& " for "
& "<span style='color:red'>"
& Count(ApplicantsFact[Applicant])
& "</span>"
& " applicants."
I'm not used to HTML. I've just written out the DAX for a column like this, which has lots of fields presented as text. Is it as simple as adding the style stuff that you've done into my calculated column written in DAX?
Hi Sud,
Maybe you can put several Textbox and a Card visual together. Then you can have the format and dynamic text.
Best Regards,
Dale
Hi @Anonymous,
It is currently not possible to change text formatting using DAX..
There is a thread about this issue, please vote it up : https://ideas.powerbi.com/forums/265200-power-bi-ideas/suggestions/31560820-extend-dax-format-functi...
Best,
Valentin
Check out the April 2026 Power BI update to learn about new features.
Sign up to receive a private message when registration opens and key events begin.
If you have recently started exploring Fabric, we'd love to hear how it's going. Your feedback can help with product improvements.
| User | Count |
|---|---|
| 30 | |
| 24 | |
| 23 | |
| 17 | |
| 15 |
| User | Count |
|---|---|
| 61 | |
| 36 | |
| 29 | |
| 22 | |
| 21 |