FabCon is coming to Atlanta
Join us at FabCon Atlanta from March 16 - 20, 2026, for the ultimate Fabric, Power BI, AI and SQL community-led event. Save $200 with code FABCOMM.
Register now!- Power BI forums
- Get Help with Power BI
- Desktop
- Service
- Report Server
- Power Query
- Mobile Apps
- Developer
- DAX Commands and Tips
- Custom Visuals Development Discussion
- Health and Life Sciences
- Power BI Spanish forums
- Translated Spanish Desktop
- Training and Consulting
- Instructor Led Training
- Dashboard in a Day for Women, by Women
- Galleries
- Data Stories Gallery
- Themes Gallery
- Contests Gallery
- QuickViz Gallery
- Quick Measures Gallery
- Visual Calculations Gallery
- Notebook Gallery
- Translytical Task Flow Gallery
- TMDL Gallery
- R Script Showcase
- Webinars and Video Gallery
- Ideas
- Custom Visuals Ideas (read-only)
- Issues
- Issues
- Events
- Upcoming Events
Get Fabric Certified for FREE during Fabric Data Days. Don't miss your chance! Request now
- Power BI forums
- Forums
- Get Help with Power BI
- Desktop
- PLZ HLP!!!! Creating calculation for Comparing Sam...
- Subscribe to RSS Feed
- Mark Topic as New
- Mark Topic as Read
- Float this Topic for Current User
- Bookmark
- Subscribe
- Printer Friendly Page
- Mark as New
- Bookmark
- Subscribe
- Mute
- Subscribe to RSS Feed
- Permalink
- Report Inappropriate Content
PLZ HLP!!!! Creating calculation for Comparing Same Date This Year versus Last Year
I am trying to do Time Series calculations (whatever that really means) for Same Date compared to Same Date Last Year. If you can kindly help me from losing more hair I would kindly appreciate your generosity!
Here are the formulas I am using
- Collections LY by trend date = CALCULATE([Collections Total],SAMEPERIODLASTYEAR(('Calendar'[Date]))) - This is still showing dates until end of year. I only want it to show data up until this years date last year.
- Collections TY by trend date = CALCULATE([Collections Total], FILTER('Calendar', 'Calendar'[Date] < TODAY()))

Date Collections TY by trend date Collections LY by trend date 11/30/2021 0:00 $34,776.25 11/28/2021 0:00 $852.91 11/27/2021 0:00 $31,860.07 11/26/2021 0:00 $207.88 11/25/2021 0:00 $52,373.37 11/24/2021 0:00 $14,278.67 11/23/2021 0:00 $31,774.04 11/22/2021 0:00 $24,062 11/20/2021 0:00 $69,379.20 11/19/2021 0:00 $12,817.15 $32,289.16 11/18/2021 0:00 $11,018.94 $16,537.48 11/17/2021 0:00 $21,989.74 $30,357.17 11/16/2021 0:00 $37,128.55 $72,194.82 11/15/2021 0:00 $6,564.91 11/13/2021 0:00 $25,637.27 11/12/2021 0:00 $17,404.07 $11,558.63 11/11/2021 0:00 $15,845.59 $18,377 11/10/2021 0:00 $14,042.51 $34,213.14 11/9/2021 0:00 $11,786.98 $36,534.50 11/8/2021 0:00 $19,856 $0 11/6/2021 0:00 $35,570.67 11/5/2021 0:00 $17,466.67 $19,411.81 11/4/2021 0:00 $30,881.84 $15,212.39 11/3/2021 0:00 $13,875.26 $32,911.77 11/2/2021 0:00 $7,060.54 $5,371.41 11/1/2021 0:00 $13,559.69 
Solved! Go to Solution.
- Mark as New
- Bookmark
- Subscribe
- Mute
- Subscribe to RSS Feed
- Permalink
- Report Inappropriate Content
@TheSweeper , In the case of the calculation group using tabular editor
CALCULATE(selectedmeasure(), FILTER('Calendar', 'Calendar'[Date] < TODAY()))
Last year
CALCULATE(selectedmeasure(), sameperiodlastyear('Calendar'[Date]), FILTER('Calendar', 'Calendar'[Date] < date(year(TODAY())-1 ,month(Today()) , day(today()))))
or
CALCULATE(selectedmeasure(), dateadd('Calendar'[Date],-1, year), 'Calendar'[Date] < date(year(TODAY())-1 ,month(Today()) , day(today())) )
- Mark as New
- Bookmark
- Subscribe
- Mute
- Subscribe to RSS Feed
- Permalink
- Report Inappropriate Content
Hi @TheSweeper ,
I created some data:
Here are the steps you can follow:
1. Create a calendar table.
Slice = CALENDARAUTO()2. Create measure.
Collections LY by trend date =
CALCULATE(SUM('Calendar'[Collections Total]),
FILTER(ALL('Calendar'),'Calendar'[Date]=DATE(YEAR(MAX('Calendar'[Date]))-1,MONTH(MAX('Calendar'[Date])),DAY(MAX('Calendar'[Date])))))
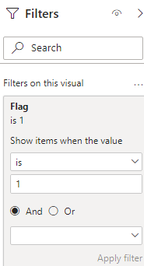
Flag =
IF(MAX('Calendar'[Date])>=MIN('Slice'[Date])&&MAX('Calendar'[Date])<=MAX('Slice'[Date]),1,0)3. Place Measure[Flag] in the filter, select is=1, and apply filter.
4. Result:
Best Regards,
Liu Yang
If this post helps, then please consider Accept it as the solution to help the other members find it more quickly
- Mark as New
- Bookmark
- Subscribe
- Mute
- Subscribe to RSS Feed
- Permalink
- Report Inappropriate Content
Hi,
Does this measure work?
Collections LY by trend date = if(min('Calendar'[Date])<=TODAY(),CALCULATE([Collections Total],SAMEPERIODLASTYEAR('Calendar'[Date])),blank())
Regards,
Ashish Mathur
http://www.ashishmathur.com
https://www.linkedin.com/in/excelenthusiasts/
- Mark as New
- Bookmark
- Subscribe
- Mute
- Subscribe to RSS Feed
- Permalink
- Report Inappropriate Content
@TheSweeper , In the case of the calculation group using tabular editor
CALCULATE(selectedmeasure(), FILTER('Calendar', 'Calendar'[Date] < TODAY()))
Last year
CALCULATE(selectedmeasure(), sameperiodlastyear('Calendar'[Date]), FILTER('Calendar', 'Calendar'[Date] < date(year(TODAY())-1 ,month(Today()) , day(today()))))
or
CALCULATE(selectedmeasure(), dateadd('Calendar'[Date],-1, year), 'Calendar'[Date] < date(year(TODAY())-1 ,month(Today()) , day(today())) )
Helpful resources

Power BI Monthly Update - November 2025
Check out the November 2025 Power BI update to learn about new features.

Fabric Data Days
Advance your Data & AI career with 50 days of live learning, contests, hands-on challenges, study groups & certifications and more!

| User | Count |
|---|---|
| 104 | |
| 82 | |
| 71 | |
| 50 | |
| 46 |


