Fabric Data Days starts November 4th!
Advance your Data & AI career with 50 days of live learning, dataviz contests, hands-on challenges, study groups & certifications and more!
Get registered- Power BI forums
- Get Help with Power BI
- Desktop
- Service
- Report Server
- Power Query
- Mobile Apps
- Developer
- DAX Commands and Tips
- Custom Visuals Development Discussion
- Health and Life Sciences
- Power BI Spanish forums
- Translated Spanish Desktop
- Training and Consulting
- Instructor Led Training
- Dashboard in a Day for Women, by Women
- Galleries
- Data Stories Gallery
- Themes Gallery
- Contests Gallery
- Quick Measures Gallery
- Visual Calculations Gallery
- Notebook Gallery
- Translytical Task Flow Gallery
- TMDL Gallery
- R Script Showcase
- Webinars and Video Gallery
- Ideas
- Custom Visuals Ideas (read-only)
- Issues
- Issues
- Events
- Upcoming Events
Join us at FabCon Atlanta from March 16 - 20, 2026, for the ultimate Fabric, Power BI, AI and SQL community-led event. Save $200 with code FABCOMM. Register now.
- Power BI forums
- Forums
- Get Help with Power BI
- Desktop
- Number sorting in text filter
- Subscribe to RSS Feed
- Mark Topic as New
- Mark Topic as Read
- Float this Topic for Current User
- Bookmark
- Subscribe
- Printer Friendly Page
- Mark as New
- Bookmark
- Subscribe
- Mute
- Subscribe to RSS Feed
- Permalink
- Report Inappropriate Content
Number sorting in text filter
Hi
I have a text filter which filters by graphs by store:
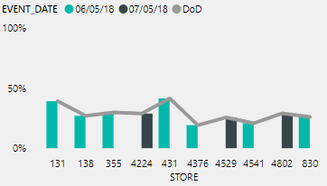
And a graph which plots each store against a value:
To stop Power BI from treating the stores as integers and summarizing the values, I've made the 'store' column a text column. Is there a way to sort the values within the filter as if they are numerical? Rather than 10, 102, 105, 106 it would be 10, 11, 102, 105, 106 etc. I can sort the filter by changing the 'store' column from text to whole number but it causes this to happen:
I've tried to change the default summarization but I don't have the option to (greyed out).
Thank you
Solved! Go to Solution.
- Mark as New
- Bookmark
- Subscribe
- Mute
- Subscribe to RSS Feed
- Permalink
- Report Inappropriate Content
Hey @carpetwotsit
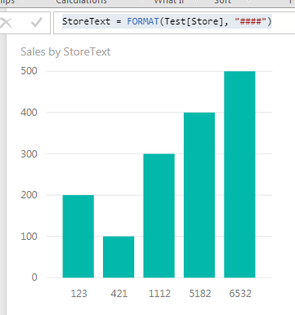
I would recommend creating a calculated column that converts the store number to text like:
StoreText = FORMAT(Test[Store], "####")
Then you can go to the Data tab and sort the StoreText column by Store. Then by putting StoreText in the axis of your visualization, you will have the proper functionality. Use the Store in any slicers though.
Hope this helps,
Parker
- Mark as New
- Bookmark
- Subscribe
- Mute
- Subscribe to RSS Feed
- Permalink
- Report Inappropriate Content
Thank you, exactly what I needed!


