FabCon is coming to Atlanta
Join us at FabCon Atlanta from March 16 - 20, 2026, for the ultimate Fabric, Power BI, AI and SQL community-led event. Save $200 with code FABCOMM.
Register now!- Power BI forums
- Get Help with Power BI
- Desktop
- Service
- Report Server
- Power Query
- Mobile Apps
- Developer
- DAX Commands and Tips
- Custom Visuals Development Discussion
- Health and Life Sciences
- Power BI Spanish forums
- Translated Spanish Desktop
- Training and Consulting
- Instructor Led Training
- Dashboard in a Day for Women, by Women
- Galleries
- Data Stories Gallery
- Themes Gallery
- Contests Gallery
- Quick Measures Gallery
- Notebook Gallery
- Translytical Task Flow Gallery
- TMDL Gallery
- R Script Showcase
- Webinars and Video Gallery
- Ideas
- Custom Visuals Ideas (read-only)
- Issues
- Issues
- Events
- Upcoming Events
To celebrate FabCon Vienna, we are offering 50% off select exams. Ends October 3rd. Request your discount now.
- Power BI forums
- Forums
- Get Help with Power BI
- Desktop
- Number of active members in matrix based on entry/...
- Subscribe to RSS Feed
- Mark Topic as New
- Mark Topic as Read
- Float this Topic for Current User
- Bookmark
- Subscribe
- Printer Friendly Page
- Mark as New
- Bookmark
- Subscribe
- Mute
- Subscribe to RSS Feed
- Permalink
- Report Inappropriate Content
Number of active members in matrix based on entry/exit date
Hey guys
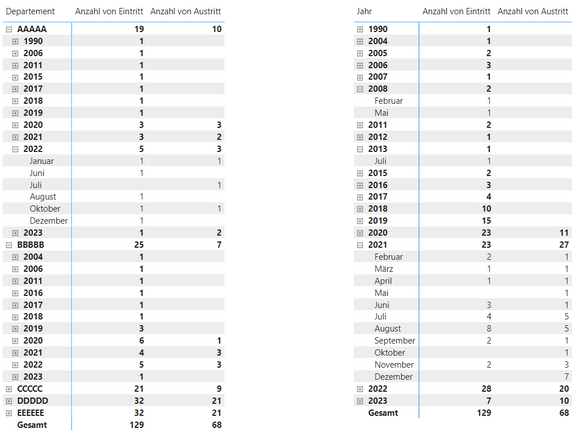
I am trying to create a report with a matrix that shows the number of entries, exits and total number of members active members based on date. After spending hours and hours on searching for and attempting different methods, I cannot get the total to work properly.
The data is in multiple tables:
Date table is connected to entry date and exit date in respective tables. And personnel table is connected to the name of entry/exit table. Exit date is only present on members that left.
The goal would be to have a third column showing total number of active members for each year/month. Preferably to also make it so can be sorted by department as shown in the first/left matrix.
Does anyone know how to do this? Or has a different approach achieving similar result?
I attached a .pbix with the sample data from the screenshots.
https://www.dropbox.com/s/m2u9zxplefx8ap4/Active%20Members%20Matrix.pbix?dl=0
Thank you!
Solved! Go to Solution.
- Mark as New
- Bookmark
- Subscribe
- Mute
- Subscribe to RSS Feed
- Permalink
- Report Inappropriate Content
Hi @Stax ,
Please check the model.
Count of Austritt = COUNT('Austritt'[Austritt])Count of Eintritt = COUNT('Eintritt'[Eintritt])total =
VAR _date =
MAX ( 'Date'[Date] )
VAR _table =
SUMMARIZECOLUMNS (
'Personal'[Departement],
'Date'[Year],
'Date'[Month],
'Date'[Date]
)
VAR _total =
CALCULATE ( [Count of Eintritt], 'Date'[Date] <= _date )
- CALCULATE ( [Count of Austritt], 'Date'[Date] <= _date )
RETURN
_totalBest Regards,
Gao
Community Support Team
If there is any post helps, then please consider Accept it as the solution to help the other members find it more quickly. If I misunderstand your needs or you still have problems on it, please feel free to let us know. Thanks a lot!
How to get your questions answered quickly -- How to provide sample data in the Power BI Forum
- Mark as New
- Bookmark
- Subscribe
- Mute
- Subscribe to RSS Feed
- Permalink
- Report Inappropriate Content
Hey @v-cgao-msft ,
That’s perfect, thanks!
I used this to build what I needed.
But I’m a bit confused - why does that work? I attempted to do something similar but couldn’t really find a way to iterate through the dates in date table.
It seems like “MAX(‘Date’[Date]) does exactly that. But why does it do that? I would’ve expected it to just return the last date in the table.
Or am I misunderstanding the whole thing completely?
Thanks again.


