Hello,
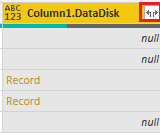
I have following data pulled from webservice. I want to present it as table like below. I was able to get first couple of columns but I'm confused what to do with DataDisk column. I want to output there sum of sizes of each of rows of `datadisk` and when user clicks on that column to show different table with rows for each datadisk.

[
  {
    "DataDisk": [],
    "OSDiskSize": 30,
    "OSDiskTier": "Premium_LRS",
    "name": "greg-win2008"
  },
  {
    "DataDisk": [],
    "OSDiskSize": null,
    "OSDiskTier": null,
    "name": "kt-dev-vm-01"
  },
  {
    "DataDisk": [
      {
        "DataDiskName": "Data",
        "DataDiskSize": 10,
        "DataDiskTier": "Standard_LRS"
      },
      {
        "DataDiskName": "Disk2",
        "DataDiskSize": 10,
        "DataDiskTier": "Standard_LRS"
      }
    ],
    "OSDiskSize": 30,
    "OSDiskTier": "Premium_LRS",
    "name": "Greg-VM"
  },
  {
    "DataDisk": [],
    "OSDiskSize": null,
    "OSDiskTier": null,
    "name": "TEstVM01"
  }
]