FabCon is coming to Atlanta
Join us at FabCon Atlanta from March 16 - 20, 2026, for the ultimate Fabric, Power BI, AI and SQL community-led event. Save $200 with code FABCOMM.
Register now!- Power BI forums
- Get Help with Power BI
- Desktop
- Service
- Report Server
- Power Query
- Mobile Apps
- Developer
- DAX Commands and Tips
- Custom Visuals Development Discussion
- Health and Life Sciences
- Power BI Spanish forums
- Translated Spanish Desktop
- Training and Consulting
- Instructor Led Training
- Dashboard in a Day for Women, by Women
- Galleries
- Data Stories Gallery
- Themes Gallery
- Contests Gallery
- QuickViz Gallery
- Quick Measures Gallery
- Visual Calculations Gallery
- Notebook Gallery
- Translytical Task Flow Gallery
- TMDL Gallery
- R Script Showcase
- Webinars and Video Gallery
- Ideas
- Custom Visuals Ideas (read-only)
- Issues
- Issues
- Events
- Upcoming Events
The Power BI Data Visualization World Championships is back! Get ahead of the game and start preparing now! Learn more
- Power BI forums
- Forums
- Get Help with Power BI
- Desktop
- Need Visual looks the same.
- Subscribe to RSS Feed
- Mark Topic as New
- Mark Topic as Read
- Float this Topic for Current User
- Bookmark
- Subscribe
- Printer Friendly Page
- Mark as New
- Bookmark
- Subscribe
- Mute
- Subscribe to RSS Feed
- Permalink
- Report Inappropriate Content
Need Visual looks the same.
I want to create a data visual in similar way. I used a Treemap Visual, but it not works same above. I need a support from Bi Community.
Solved! Go to Solution.
- Mark as New
- Bookmark
- Subscribe
- Mute
- Subscribe to RSS Feed
- Permalink
- Report Inappropriate Content
Hi @NavaneethaRaju ,
Have you considered using the Tree Map visual object:
https://docs.microsoft.com/en-us/power-bi/visuals/power-bi-visualization-treemaps
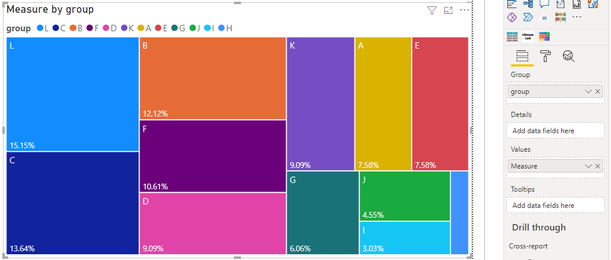
I created some data:
Here are the steps you can follow:
1. Select Tree map to form the following figure.
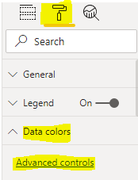
2. Select Format – Data colors – Advanced controls.
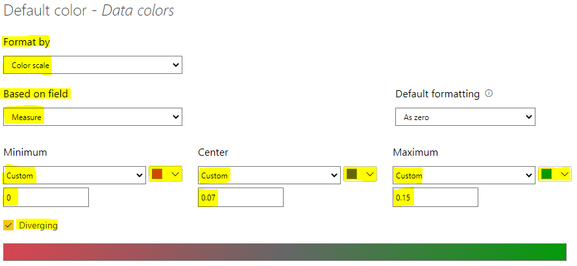
Enter the Default color interface.
Format by – Color scale.
Based on field – [Measure].
Choose Diverging, which is equivalent to the intermediate value, and then you can customize the rules and colors by yourself
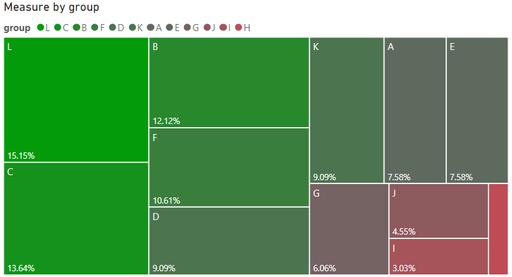
3. Result:
Best Regards,
Liu Yang
If this post helps, then please consider Accept it as the solution to help the other members find it more quickly
- Mark as New
- Bookmark
- Subscribe
- Mute
- Subscribe to RSS Feed
- Permalink
- Report Inappropriate Content
Have you seen this visual:
https://appsource.microsoft.com/en-us/product/power-bi-visuals/WA200000043?tab=Overview
If this post helps, please consider accepting it as the solution to help the other members find it more quickly.
Appreciate your Kudos!!
- Mark as New
- Bookmark
- Subscribe
- Mute
- Subscribe to RSS Feed
- Permalink
- Report Inappropriate Content
Helpful resources

Power BI Dataviz World Championships
The Power BI Data Visualization World Championships is back! Get ahead of the game and start preparing now!

| User | Count |
|---|---|
| 39 | |
| 38 | |
| 38 | |
| 28 | |
| 25 |
| User | Count |
|---|---|
| 124 | |
| 87 | |
| 70 | |
| 66 | |
| 65 |


