Get certified for free when you join Fabric Data Days 2026 and dive into Fabric, Power BI, SQL, AI, and other essential data skills.
Join nowJuly 7 - July 17 | Round 2 of the Power BI Dataviz World Championships. Don't miss your chance! Learn more
Hi everybody!
I'm in the process of calculating a YTD Inflation. For this, I have a table of Inflation with Country, Month, GrowthPercentage. The calculation for this is:
For the months of the selected period sum 1 to each growth, multiply all of them, and subtract 1 to the result.
Example: 0.03 >> 1.03
1.03*1.12*1.18*1.01 = 1.37
1.37 >> 0.37 >> 37%
How can I perform this? Because there is SUM and SUMX function, but here what I need is a MULT funcion or something to multiply. Any ideas?
Thanks in advance.
Solved! Go to Solution.
Hi @Anonymous
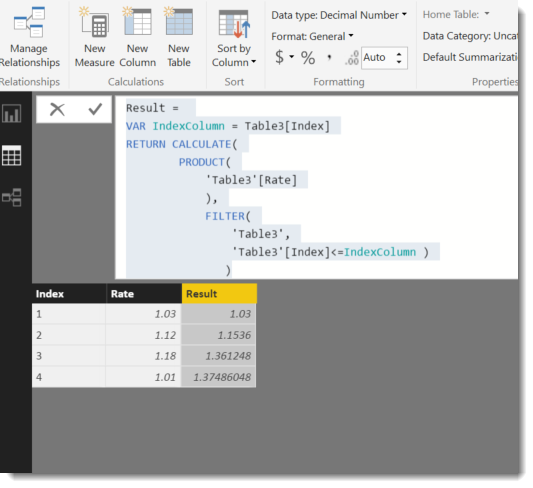
If I understand you correctly I think the PRODUCT fucntion may probably work. If you are happy with the essence of the function, it can be extended to work with your data.
Result =
VAR IndexColumn = Table3[Index]
RETURN CALCULATE(
PRODUCT(
'Table3'[Rate]
),
FILTER(
'Table3',
'Table3'[Index]<=IndexColumn )
)
Hi @Anonymous
If I understand you correctly I think the PRODUCT fucntion may probably work. If you are happy with the essence of the function, it can be extended to work with your data.
Result =
VAR IndexColumn = Table3[Index]
RETURN CALCULATE(
PRODUCT(
'Table3'[Rate]
),
FILTER(
'Table3',
'Table3'[Index]<=IndexColumn )
)
So many thanks @Phil_Seamark!
That was exactly what I been looking for. I perfectly performed what I needed.
Have a great day!
Join us in Barcelona for FabCon and SQLCon, the Fabric, Power BI, SQL, and AI community event. Save €200 with code FABCMTY200.
Join Fabric Data Days 2026: 60 days of free live/on-demand sessions, challenges, study groups, and certification opportunities.
| User | Count |
|---|---|
| 24 | |
| 24 | |
| 17 | |
| 14 | |
| 13 |
| User | Count |
|---|---|
| 63 | |
| 41 | |
| 39 | |
| 39 | |
| 39 |