- Power BI forums
- Updates
- News & Announcements
- Get Help with Power BI
- Desktop
- Service
- Report Server
- Power Query
- Mobile Apps
- Developer
- DAX Commands and Tips
- Custom Visuals Development Discussion
- Health and Life Sciences
- Power BI Spanish forums
- Translated Spanish Desktop
- Power Platform Integration - Better Together!
- Power Platform Integrations (Read-only)
- Power Platform and Dynamics 365 Integrations (Read-only)
- Training and Consulting
- Instructor Led Training
- Dashboard in a Day for Women, by Women
- Galleries
- Community Connections & How-To Videos
- COVID-19 Data Stories Gallery
- Themes Gallery
- Data Stories Gallery
- R Script Showcase
- Webinars and Video Gallery
- Quick Measures Gallery
- 2021 MSBizAppsSummit Gallery
- 2020 MSBizAppsSummit Gallery
- 2019 MSBizAppsSummit Gallery
- Events
- Ideas
- Custom Visuals Ideas
- Issues
- Issues
- Events
- Upcoming Events
- Community Blog
- Power BI Community Blog
- Custom Visuals Community Blog
- Community Support
- Community Accounts & Registration
- Using the Community
- Community Feedback
Register now to learn Fabric in free live sessions led by the best Microsoft experts. From Apr 16 to May 9, in English and Spanish.
- Power BI forums
- Forums
- Get Help with Power BI
- Desktop
- Multiple Donut Charts with interaction
- Subscribe to RSS Feed
- Mark Topic as New
- Mark Topic as Read
- Float this Topic for Current User
- Bookmark
- Subscribe
- Printer Friendly Page
- Mark as New
- Bookmark
- Subscribe
- Mute
- Subscribe to RSS Feed
- Permalink
- Report Inappropriate Content
Multiple Donut Charts with interaction
Hello,
I have a requirement to create a dunut chart with mutilple levels as shown in the image with filter interaction. I have used sunburn custom visual, but it is not interactive as good as built in filter interaction where it changes the view based on the filters applied.
The only issue which i am facing is if i select any one of the donut (ex: donut 2) it will disable the other two donuts, hence i wont be able to click on it, as it is currently highlighting donut 2. I have tried formatting like bringing front/ moving back, but still not able to get what i needed.
Can you suggest some solutions, if you come across these kind of requirements.

Thanks in advance,
Parac
- Mark as New
- Bookmark
- Subscribe
- Mute
- Subscribe to RSS Feed
- Permalink
- Report Inappropriate Content
hi all,
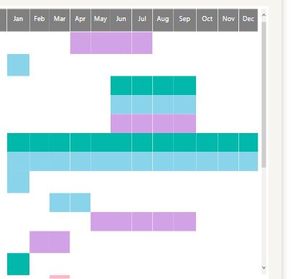
how to implement to the power bi matrix table month column based on tables cell show to start date and end date
expected output is
thanks and regards
herwin
- Mark as New
- Bookmark
- Subscribe
- Mute
- Subscribe to RSS Feed
- Permalink
- Report Inappropriate Content
@Anonymous its hard to see what you have done to set it up, are these 3 seperate objects? if so you can edit the interactions but not allowing any donut to be filtered
click on edit interactions which is next to send to back etc. and then
https://docs.microsoft.com/en-us/power-bi/service-reports-visual-interactions and then on the object you dont want to be filtered, select the circle with a diagonal line through it
If I took the time to answer your question and I came up with a solution, please mark my post as a solution and /or give kudos freely for the effort 🙂 Thank you!
Proud to be a Super User!
- Mark as New
- Bookmark
- Subscribe
- Mute
- Subscribe to RSS Feed
- Permalink
- Report Inappropriate Content
Hi @vanessafvg,
Thanks for your response.
There are 3 donuts put one inside the other in the above image. Edit interaction has already enabled and it is filtering properly. The only problem which I am facing is, when I hover/click on any one of the donut, it will highlight that particular donut and it will send back the other 2. Then, if I want to filter the other donut, I am not able to click as it is sent back. I can click on only 1 visual at a time, as it puts one inside the other and sends another 2 back on each click.
I believe this will give you clarity on the issue.
Regards,Park
- Mark as New
- Bookmark
- Subscribe
- Mute
- Subscribe to RSS Feed
- Permalink
- Report Inappropriate Content
hi, @Anonymous
After my research, I'm afraid it couldn't achieve for now.
If you could try custom visual: Drill-down donut chart
https://appsource.microsoft.com/en-us/product/power-bi-visuals/WA104380858?src=office
Best Regards,
Lin
If this post helps, then please consider Accept it as the solution to help the other members find it more quickly.
Helpful resources

Microsoft Fabric Learn Together
Covering the world! 9:00-10:30 AM Sydney, 4:00-5:30 PM CET (Paris/Berlin), 7:00-8:30 PM Mexico City

Power BI Monthly Update - April 2024
Check out the April 2024 Power BI update to learn about new features.

| User | Count |
|---|---|
| 109 | |
| 99 | |
| 77 | |
| 66 | |
| 54 |
| User | Count |
|---|---|
| 144 | |
| 104 | |
| 102 | |
| 87 | |
| 64 |


