Join the Fabric User Panel to shape the future of Fabric.
Share feedback directly with Fabric product managers, participate in targeted research studies and influence the Fabric roadmap.
Sign up now- Power BI forums
- Get Help with Power BI
- Desktop
- Service
- Report Server
- Power Query
- Mobile Apps
- Developer
- DAX Commands and Tips
- Custom Visuals Development Discussion
- Health and Life Sciences
- Power BI Spanish forums
- Translated Spanish Desktop
- Training and Consulting
- Instructor Led Training
- Dashboard in a Day for Women, by Women
- Galleries
- Data Stories Gallery
- Themes Gallery
- Contests Gallery
- QuickViz Gallery
- Quick Measures Gallery
- Visual Calculations Gallery
- Notebook Gallery
- Translytical Task Flow Gallery
- TMDL Gallery
- R Script Showcase
- Webinars and Video Gallery
- Ideas
- Custom Visuals Ideas (read-only)
- Issues
- Issues
- Events
- Upcoming Events
Get Fabric certified for FREE! Don't miss your chance! Learn more
- Power BI forums
- Forums
- Get Help with Power BI
- Desktop
- Multiple Dimensions, Multiple Facts Data Model
- Subscribe to RSS Feed
- Mark Topic as New
- Mark Topic as Read
- Float this Topic for Current User
- Bookmark
- Subscribe
- Printer Friendly Page
- Mark as New
- Bookmark
- Subscribe
- Mute
- Subscribe to RSS Feed
- Permalink
- Report Inappropriate Content
Multiple Dimensions, Multiple Facts Data Model
Is it possible in Power BI to model multiple dimensions and multiple facts?
To simplify from first-principles, imagine I have two fact tables:
1) Stock Data Time Series (Asset Class, Date, Price to Earnings Ratio, +20 other Stock ratios)
2) Bond Data Time Series (Asset Class, Date, Yield to Maturity, +20 other Bond ratios)
and two dimension tables:
1) Asset Class MetaData (links to stock and bond data by asset class, or asset class index)
2) Date table (links to stock and bond data by date, or date index)
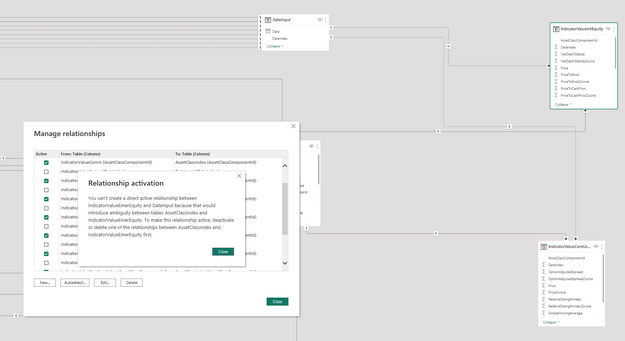
I have issues autodetecting these relationships, and get errors activating the relationships:
I think this would be a standard schema for database normalization, so am curious if this is possible to model in power bi, or if I need to adjust the data model? Ultimately, I intend to scale this to ~10 fact tables (1 per asset class) and two dimension tables.
My goal is to get time series data to compare ratios across the two different fact tables on a single visualization (using the date table for common lin), rather than 2 separate tables as below:
I know I can do this if I remove the asset class table and just link the two fact tables to the date dimension, but I also need assetclass dimension metadata pertaining to all fact tables (e.g., risk level) necessary for data visualization purposes.
Any modeling advice would be appreciated (maybe I'm not thinking about this the right way), thank you in advance.
Thanks!
Solved! Go to Solution.
- Mark as New
- Bookmark
- Subscribe
- Mute
- Subscribe to RSS Feed
- Permalink
- Report Inappropriate Content
Yes, you can model multiple dimensions and multiple facts. Create a relationship between each fact table and the dimension tables as shown below:
You can add as many fact tables as you need. In a visual, use fields from dimension tables and you'll be able to see measures for each fact table since the fact tables share dimension tables.
Did I answer your question? Mark my post as a solution!
Proud to be a Super User!
- Mark as New
- Bookmark
- Subscribe
- Mute
- Subscribe to RSS Feed
- Permalink
- Report Inappropriate Content
- Mark as New
- Bookmark
- Subscribe
- Mute
- Subscribe to RSS Feed
- Permalink
- Report Inappropriate Content
Yes, you can model multiple dimensions and multiple facts. Create a relationship between each fact table and the dimension tables as shown below:
You can add as many fact tables as you need. In a visual, use fields from dimension tables and you'll be able to see measures for each fact table since the fact tables share dimension tables.
Did I answer your question? Mark my post as a solution!
Proud to be a Super User!
- Mark as New
- Bookmark
- Subscribe
- Mute
- Subscribe to RSS Feed
- Permalink
- Report Inappropriate Content
Thanks, your graphic showed me the issue I was having - needed to have single direction cross filters rather than bi-directional, which was selected. Appreciate the help!
Helpful resources

Join our Fabric User Panel
Share feedback directly with Fabric product managers, participate in targeted research studies and influence the Fabric roadmap.

| User | Count |
|---|---|
| 63 | |
| 62 | |
| 42 | |
| 19 | |
| 16 |
| User | Count |
|---|---|
| 118 | |
| 106 | |
| 38 | |
| 28 | |
| 27 |


