Join us at FabCon Vienna from September 15-18, 2025
The ultimate Fabric, Power BI, SQL, and AI community-led learning event. Save €200 with code FABCOMM.
Get registered- Power BI forums
- Get Help with Power BI
- Desktop
- Service
- Report Server
- Power Query
- Mobile Apps
- Developer
- DAX Commands and Tips
- Custom Visuals Development Discussion
- Health and Life Sciences
- Power BI Spanish forums
- Translated Spanish Desktop
- Training and Consulting
- Instructor Led Training
- Dashboard in a Day for Women, by Women
- Galleries
- Data Stories Gallery
- Themes Gallery
- Contests Gallery
- Quick Measures Gallery
- Notebook Gallery
- Translytical Task Flow Gallery
- TMDL Gallery
- R Script Showcase
- Webinars and Video Gallery
- Ideas
- Custom Visuals Ideas (read-only)
- Issues
- Issues
- Events
- Upcoming Events
Enhance your career with this limited time 50% discount on Fabric and Power BI exams. Ends September 15. Request your voucher.
- Power BI forums
- Forums
- Get Help with Power BI
- Desktop
- Measure from non related Table Always null
- Subscribe to RSS Feed
- Mark Topic as New
- Mark Topic as Read
- Float this Topic for Current User
- Bookmark
- Subscribe
- Printer Friendly Page
- Mark as New
- Bookmark
- Subscribe
- Mute
- Subscribe to RSS Feed
- Permalink
- Report Inappropriate Content
Measure from non related Table Always null
Hi Everyone, I hope somebdy will be able to help me, i've been reading hundreds of forum topics all night long, and im desperate right now 😕
Here is my schema of Data,
Here is the content of Fact Promotion :
| Date Key | Product LCBO Key | Product bridge key | bottle size | Cases 9L |
| 20200101 | 111 | BBB | 750 | 0.833 |
| 20200101 | 222 | CCC | 750 | 0.444 |
| 20200101 | 333 | DDD | 750 | 0.856 |
here is the content of my table Finance :
| Date Key | Product LCBO Key | Product bridge key | Shipment Actual Cost Of Goods Sold |
| 2020 | 222 | BBB | 1.670333 |
| 2020 | 222 | AAA | 22.499000 |
| 2020 | 333 | DDD | 0.563226 |
The idea here is to create a measure called
COGS_TOTAL = [sum9l] * [total Shipment Actual Cost Of Goods Sold]
with :
sum9l = Sum(Fact promotion[Cases 9L])
total Shipment Actual Cost Of Goods Sold = sum(Shipment Actual Cost Of Goods Sold)
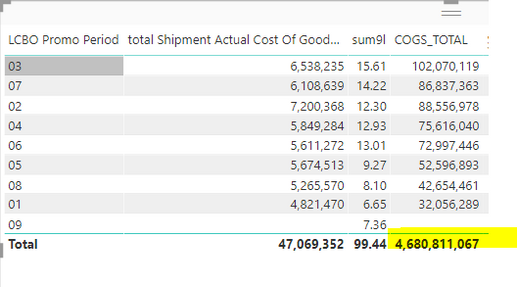
The total of COGS_TOTAL is correct but I want to have it as a sum of all the rows above. which mean 553385589
So I readed about 30 topic of this forum to understand this is a total measure issue and that i need to do a simple SUMX.
BUT then when I do my
SUMX_COGS_TOTAL = SUMX(Calendars, [sum9l] * [total Shipment Actual Cost Of Goods Sold])
The result is completely different but at least is now the sum of every rows, BUT let me add the product dimensions right now :
Result is now completely WRONG.
So after reading many topics, I understand that if i want to slice by many dimensions, I need to use summarize function with addcolumn somehting like :
SUMMARIZE_COGS_TOTAL = SUMX (
    ADDCOLUMNS (
        SUMMARIZE (
            'Facts Promotion',
            'Facts Promotion'[Cases 9L],
            'Product LCBO'[LCBO SKU No],
            Calendars[Date Key],
           'Financial'[Shipment Actual Cost Of Goods Sold]
        ),
        "COGS", [sum9l] * [total Shipment Actual Cost Of Goods Sold]
    ),
    [COGS]
)
But i have errors :
Which is normal because there is no direct relationship between Fact promotion table & Financials.
Im sorry I cannot share the PBIX because there is sensible information, But i will do my best to give you all informations.
I tried my best to read everything on this forum, but my issue seems to be more complex than expected.
- Mark as New
- Bookmark
- Subscribe
- Mute
- Subscribe to RSS Feed
- Permalink
- Report Inappropriate Content
Your example data does suggest the DateKey granularity is not the same, but maybe that is just a typo. In any case, because you have two fact tables, you are not able to use SUMMARIZE on just one of them. You could try a CROSSJOIN expression like this:
COGS =
SUMX (
CROSSJOIN ( VALUES ( Calendars[DateKey] ), VALUES ( Product[LCBO SKU] ) ),
[sum91] * [total shipment Cost of Goods Sold]
)
Pat
Did I answer your question? Mark my post as a solution! Kudos are also appreciated!
To learn more about Power BI, follow me on Twitter or subscribe on YouTube.
@mahoneypa HoosierBI on YouTube
- Mark as New
- Bookmark
- Subscribe
- Mute
- Subscribe to RSS Feed
- Permalink
- Report Inappropriate Content
Hi @mahoneypat thank you again for helping me 🙂
I think i'm going to the right direction,
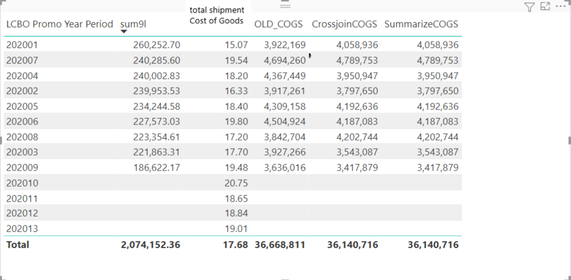
Here is the result of my calculation:
OLD_COGS here is a simple :
[sum9l] * [total shipment Cost of Goods Sold]
CrossjoinCOGS is :
So basically I put all related table from both fact tables in the crossjoin section, is that correct ?
CrossjoinCOGS
    = SUMX (
        CROSSJOIN (
            VALUES ( 'Product Master'[Product Key] ),
            VALUES ( 'Product LCBO'[Lcbo_Product_Key] ),
            VALUES ( 'Channel Finance'[Channel Code] ),
            VALUES ( Calendars[Date Key] )
        ),
        [sum91] * [total shipment Cost of Goods Sold]
    )
And summarizeCOGS is
Basically I put all related column from both fact tables, same questions is that correct ?
SummarizeCOGS =
SUMX (
    ADDCOLUMNS (
        SUMMARIZE (
            'Financials',
            'Product LCBO'[LCBO SKU No],
            'Channel Finance'[Channel Code],
            'Product Master'[Product Key],
            'Calendars'[Date Key]
        ),
        "COGS", [sum91] * [total shipment Cost of Goods Sold]
    ),
    [COGS]
)
I'm happy, because i feel like I have the same result with both calculation, however an other question come to my mind :
- Is this result being lower than the initial one is because we take all values that we have in common ? just like a innerjoin in SQL right ?
- In terms of performance, what calculation should I use ?
Thank you so much again @mahoneypat & @PaulDBrown for answering
- Mark as New
- Bookmark
- Subscribe
- Mute
- Subscribe to RSS Feed
- Permalink
- Report Inappropriate Content
I wasn't sure if your two measures use columns in both fact tables or not. If the SUMMARIZE one gives the expected values, I would expect it to be more performant. However, since you have both written, I would try them separately in your visual and view the results with Performance Analyzer (or just try them both out qualitatively) and see which one is faster.
Pat
Did I answer your question? Mark my post as a solution! Kudos are also appreciated!
To learn more about Power BI, follow me on Twitter or subscribe on YouTube.
@mahoneypa HoosierBI on YouTube
- Mark as New
- Bookmark
- Subscribe
- Mute
- Subscribe to RSS Feed
- Permalink
- Report Inappropriate Content
Where is the LCBO Promo Period field coming from?
Also do the date keys in your Finance and Fact promotion have the same granularity (it seems the Finance table has a year granularity while the Fact Promotion table has a day granularity).
Also make sure that any fields in the visual come from the dimension tables (not the fact tables)
Did I answer your question? Mark my post as a solution!
In doing so, you are also helping me. Thank you!
Proud to be a Super User!
Paul on Linkedin.
- Mark as New
- Bookmark
- Subscribe
- Mute
- Subscribe to RSS Feed
- Permalink
- Report Inappropriate Content
Thank you @PaulDBrown for taking the time to replying me.
Where is the LCBO Promo Period field coming from?
LCBO Promo Period is coming from my table Calendar (which is linked to both fact tables (financial & fact promotion))
Also do the date keys in your Finance and Fact promotion have the same granularity (it seems the Finance table has a year granularity while the Fact Promotion table has a day granularity).
No, both fact tables has the same granularity (date key) and have same dimensions linked to them (Calendar / Product LCBO / product Bridge )
Also make sure that any fields in the visual come from the dimension tables (not the fact tables)
- Mark as New
- Bookmark
- Subscribe
- Mute
- Subscribe to RSS Feed
- Permalink
- Report Inappropriate Content
@Anonymous
Perhaps try:
_measure = SUMX(
SUMMARIZE(calendar, Calendar [LCBO Promo Period], "_COGS", [sum9l] * [total Shipment Actual Cost Of Goods Sold]),
[_COGS])
Did I answer your question? Mark my post as a solution!
In doing so, you are also helping me. Thank you!
Proud to be a Super User!
Paul on Linkedin.
- Mark as New
- Bookmark
- Subscribe
- Mute
- Subscribe to RSS Feed
- Permalink
- Report Inappropriate Content
I've Also tried to read this post which look like the same issue finally as me, but no one answer too 😕
SUMX with multiple tables - Microsoft Power BI Community
Should i create a temporary table to store the values ? trying to link my fact promotion with financials table ?


