Join us at FabCon Vienna from September 15-18, 2025
The ultimate Fabric, Power BI, SQL, and AI community-led learning event. Save €200 with code FABCOMM.
Get registered- Power BI forums
- Get Help with Power BI
- Desktop
- Service
- Report Server
- Power Query
- Mobile Apps
- Developer
- DAX Commands and Tips
- Custom Visuals Development Discussion
- Health and Life Sciences
- Power BI Spanish forums
- Translated Spanish Desktop
- Training and Consulting
- Instructor Led Training
- Dashboard in a Day for Women, by Women
- Galleries
- Data Stories Gallery
- Themes Gallery
- Contests Gallery
- Quick Measures Gallery
- Notebook Gallery
- Translytical Task Flow Gallery
- TMDL Gallery
- R Script Showcase
- Webinars and Video Gallery
- Ideas
- Custom Visuals Ideas (read-only)
- Issues
- Issues
- Events
- Upcoming Events
Compete to become Power BI Data Viz World Champion! First round ends August 18th. Get started.
- Power BI forums
- Forums
- Get Help with Power BI
- Desktop
- Measure doesn't display all cell value
- Subscribe to RSS Feed
- Mark Topic as New
- Mark Topic as Read
- Float this Topic for Current User
- Bookmark
- Subscribe
- Printer Friendly Page
- Mark as New
- Bookmark
- Subscribe
- Mute
- Subscribe to RSS Feed
- Permalink
- Report Inappropriate Content
Measure doesn't display all cell value
I'm trying to calculate with a measure the portfolio of open orders value for a warehouse day by day, that is the value of every purchase order that has been purchased but not arrived to the warehous yet, so I made this formula with these filters:
MEASURE=
IMAGE: https://ibb.co/YQmTtF1
The problem is that it doesn't populate every day, but only few cells. I'd expect every cell of the column to be populated. Why? Is the measure wrong or is it not right to use a measure in this case?
- Mark as New
- Bookmark
- Subscribe
- Mute
- Subscribe to RSS Feed
- Permalink
- Report Inappropriate Content
@Anonymous , I looked at formula and few filter are not very clear
like
YEAR ( 'F - Inventory'[Physical date] ) = 1900
|| 'F - Inventory'[Physical date] > data (date ?, is it date ?)
Post that you have commented or used OR, also not clear.
The way out is to add filters one by one check which one fails.
Can you share sample data and sample output in table format? Or a sample pbix after removing sensitive data. And conditions you want to build formula
- Mark as New
- Bookmark
- Subscribe
- Mute
- Subscribe to RSS Feed
- Permalink
- Report Inappropriate Content
@amitchandak thank you for your answer. I deleted the commented part in the formula, I totally forgot about that.
This formula: YEAR ( 'F - Inventory'[Physical date] ) = 1900 || 'F - Inventory'[Physical date] > data
means that I want to filter by the year 1900 that is the default year of items which transaction is not yer arrived in the warehouse (otherwise it has a plausible date) or by a date that is after my relative date values in the column (so the item is arrived in a date after). This because I have to reconstruct the portfolio in the past, so every row, that is referred to a particular day has to calculate the value based on that day...
The condition are those I explained: for each day I want to see value of the orders purchased but not arrived in my warehouse yet . What I want is to have values on all the cell of the column, instead I have some day valorized and some not (see the link to image in my last post).
- Mark as New
- Bookmark
- Subscribe
- Mute
- Subscribe to RSS Feed
- Permalink
- Report Inappropriate Content
@Anonymous Can you post sample data and expected output? Thanks.
Follow on LinkedIn
@ me in replies or I'll lose your thread!!!
Instead of a Kudo, please vote for this idea
Become an expert!: Enterprise DNA
External Tools: MSHGQM
YouTube Channel!: Microsoft Hates Greg
Latest book!: DAX For Humans
DAX is easy, CALCULATE makes DAX hard...
- Mark as New
- Bookmark
- Subscribe
- Mute
- Subscribe to RSS Feed
- Permalink
- Report Inappropriate Content
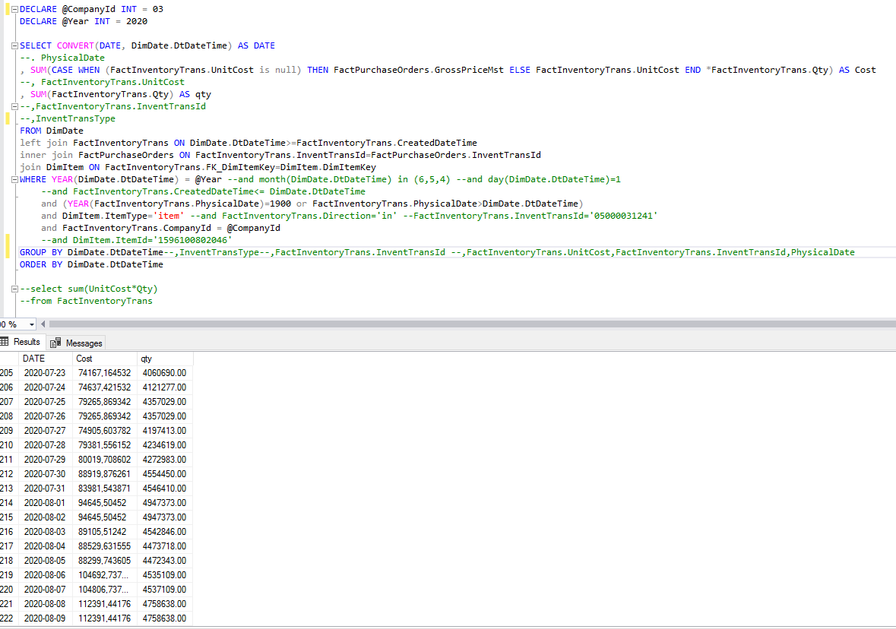
I've cut out the other column and now all cells are populated, but that is not the result I expected because there are very big variation from one cell to another. What I expect is a table like this (second column values are what I want):
DECLARE @CompanyId INT = 03
DECLARE @Year INT = 2020
SELECT CONVERT(DATE, DimDate.DtDateTime) AS DATE
, SUM(CASE WHEN (FactInventoryTrans.UnitCost is null) THEN FactPurchaseOrders.GrossPriceMst ELSE FactInventoryTrans.UnitCost END *FactInventoryTrans.Qty) AS Cost
, SUM(FactInventoryTrans.Qty) AS qty
FROM DimDate
left join FactInventoryTrans ON DimDate.DtDateTime>=FactInventoryTrans.CreatedDateTime
inner join FactPurchaseOrders ON FactInventoryTrans.InventTransId=FactPurchaseOrders.InventTransId
join DimItem ON FactInventoryTrans.FK_DimItemKey=DimItem.DimItemKey
WHERE YEAR(DimDate.DtDateTime) = @Year
and (YEAR(FactInventoryTrans.PhysicalDate)=1900 or FactInventoryTrans.PhysicalDate>DimDate.DtDateTime)
and DimItem.ItemType='item'
and FactInventoryTrans.CompanyId = @CompanyId
GROUP BY DimDate.DtDateTime
ORDER BY DimDate.DtDateTime
Here's the file where I try the formula: https://drive.google.com/file/d/1yU4ljV7Q5V6-8VnGAqmc8CxyJ6wjVvje/view?usp=sharing
If you prefer, my alternetive question is: how do I traduce the SQL query in the image in DAX? I was trying to replicate it with the first formula I posted, but the results are not equal.


