Join us at FabCon Vienna from September 15-18, 2025
The ultimate Fabric, Power BI, SQL, and AI community-led learning event. Save €200 with code FABCOMM.
Get registered- Power BI forums
- Get Help with Power BI
- Desktop
- Service
- Report Server
- Power Query
- Mobile Apps
- Developer
- DAX Commands and Tips
- Custom Visuals Development Discussion
- Health and Life Sciences
- Power BI Spanish forums
- Translated Spanish Desktop
- Training and Consulting
- Instructor Led Training
- Dashboard in a Day for Women, by Women
- Galleries
- Data Stories Gallery
- Themes Gallery
- Contests Gallery
- Quick Measures Gallery
- Notebook Gallery
- Translytical Task Flow Gallery
- TMDL Gallery
- R Script Showcase
- Webinars and Video Gallery
- Ideas
- Custom Visuals Ideas (read-only)
- Issues
- Issues
- Events
- Upcoming Events
Compete to become Power BI Data Viz World Champion! First round ends August 18th. Get started.
- Power BI forums
- Forums
- Get Help with Power BI
- Desktop
- Measure behaving differently depending on visual
- Subscribe to RSS Feed
- Mark Topic as New
- Mark Topic as Read
- Float this Topic for Current User
- Bookmark
- Subscribe
- Printer Friendly Page
- Mark as New
- Bookmark
- Subscribe
- Mute
- Subscribe to RSS Feed
- Permalink
- Report Inappropriate Content
Measure behaving differently depending on visual
Hi community,
I'm doing some testing on a simple model: 1 fact table (Sales) connected to a dimension table (Products) and a calendar
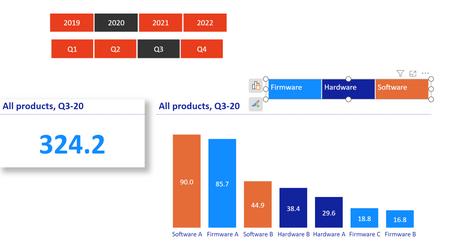
I have 2 visuals: 1 card and 1 column chart
2 filters: Year and quarters
1 tree map for selecting 'Product category' which I'm using as a filter to highlight a sub-category 'Product type' on column chart
1 measure "Visuals titles" for both visuals' to create dynamic titles:
Visuals titles =
VAR AllProducts =
IF (
ISBLANK ( SELECTEDVALUE ( 'Calendar'[Quarter/Year] ) ),
"All products, " & SELECTEDVALUE ( 'Calendar'[Year] ),
"All products, " & SELECTEDVALUE ( 'Calendar'[Quarter/Year] )
)
VAR SingleProduct =
IF (
ISBLANK ( SELECTEDVALUE ( 'Calendar'[Quarter/Year] ) ),
SELECTEDVALUE ( Products[Product category] ) & ", "
& SELECTEDVALUE ( 'Calendar'[Year] ),
SELECTEDVALUE ( Products[Product category] ) & ", "
& SELECTEDVALUE ( 'Calendar'[Quarter/Year] )
)
RETURN
IF (
ISBLANK ( SELECTEDVALUE ( Products[Product category] ) ),
AllProducts,
SingleProduct
)
If no product is selected, then both visuals' titles behave correctly
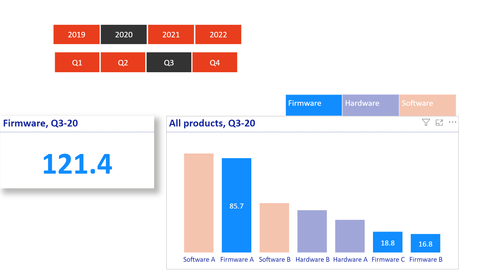
But if I select a product category (for example Firmware),then only the card is displaying the correct title but not the column chart:
The column chart still displaying 'All products' instead of 'Firmware' and don't understand why that is.
Besides if instead of a treemap I use a filter instead for 'Product category' then it works but I'd like to keep a treemap as I'd like the chart to be highlighted and not filtered.
Can you help?
Thank you!
Sax
- Mark as New
- Bookmark
- Subscribe
- Mute
- Subscribe to RSS Feed
- Permalink
- Report Inappropriate Content
The treemap isn't filtering the column chart, its cross highlighting it, which means that no filters are passed into your measure. I don't think that there is a way to detect whether or not cross highlighting is in effect.
You could use Edit Interactions to make the treemap filter the column chart instead of cross highlighting, that should work.
- Mark as New
- Bookmark
- Subscribe
- Mute
- Subscribe to RSS Feed
- Permalink
- Report Inappropriate Content
Hi, thanks. I know that filtering would work but it's something that I wanted to avoid.
But conceptually, I still don't understand, why is the treemap working for the card and not for column chart?
Thanks
- Mark as New
- Bookmark
- Subscribe
- Mute
- Subscribe to RSS Feed
- Permalink
- Report Inappropriate Content
In the card the value from the treemap is being as a filter, so SELECTEDVALUE will return a single value. Because the column chart is not being filtered then SELECTEDVALUE will return blank, as multiple values are visible, so your measure will return the value for all products.
- Mark as New
- Bookmark
- Subscribe
- Mute
- Subscribe to RSS Feed
- Permalink
- Report Inappropriate Content
Thanks...what you just said is still sinking in due to my limited knowledge of functions.
I guess another more creative way is to deselect the column chart's title and overlay the card's title instead...


