Join us at the 2025 Microsoft Fabric Community Conference
March 31 - April 2, 2025, in Las Vegas, Nevada. Use code MSCUST for a $150 discount! Early bird discount ends December 31.
Register Now- Power BI forums
- Get Help with Power BI
- Desktop
- Service
- Report Server
- Power Query
- Mobile Apps
- Developer
- DAX Commands and Tips
- Custom Visuals Development Discussion
- Health and Life Sciences
- Power BI Spanish forums
- Translated Spanish Desktop
- Training and Consulting
- Instructor Led Training
- Dashboard in a Day for Women, by Women
- Galleries
- Community Connections & How-To Videos
- COVID-19 Data Stories Gallery
- Themes Gallery
- Data Stories Gallery
- R Script Showcase
- Webinars and Video Gallery
- Quick Measures Gallery
- 2021 MSBizAppsSummit Gallery
- 2020 MSBizAppsSummit Gallery
- 2019 MSBizAppsSummit Gallery
- Events
- Ideas
- Custom Visuals Ideas
- Issues
- Issues
- Events
- Upcoming Events
Be one of the first to start using Fabric Databases. View on-demand sessions with database experts and the Microsoft product team to learn just how easy it is to get started. Watch now
- Power BI forums
- Forums
- Get Help with Power BI
- Desktop
- Re: Matrix row totals are incorrect
- Subscribe to RSS Feed
- Mark Topic as New
- Mark Topic as Read
- Float this Topic for Current User
- Bookmark
- Subscribe
- Printer Friendly Page
- Mark as New
- Bookmark
- Subscribe
- Mute
- Subscribe to RSS Feed
- Permalink
- Report Inappropriate Content
Matrix row totals are incorrect
I have been trying to show some measure of cross-correlation between a criticality factor and a performance rating. I was hoping to use weighted averages, but the weighted average function in PBI does not seem to work (at least, not for my data).
So, I have a set of data from a survey of several respondents, regarding features of a product and how those features perform in several different models of the product. The respondents have varying degrees of familiarity with the different models, so most have only entered performance ratings in 1 or 2 products (3 tops). I have created a column that cross-mulitplies the performance rating (0-10) times the criticality score (1-5).
Because some models have been used by more people, I want to use the average cross-multiplied score (to control for the number of respondents using a particular model).
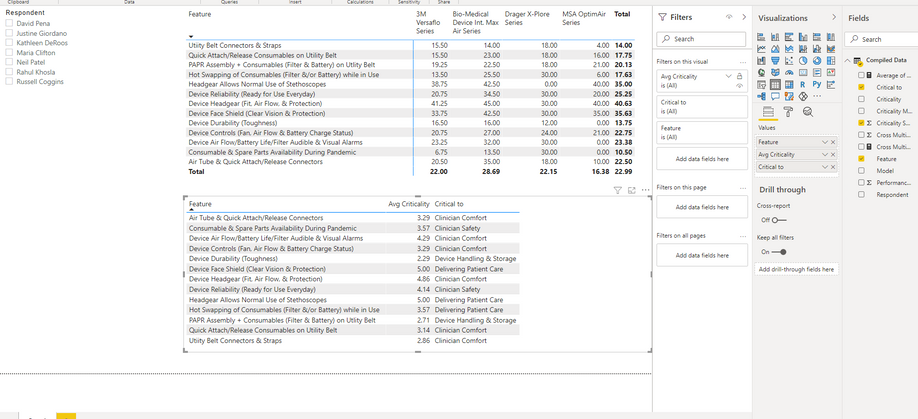
So, I put together a matrix with features in rows and product models in columns, and this is what I got (snip):
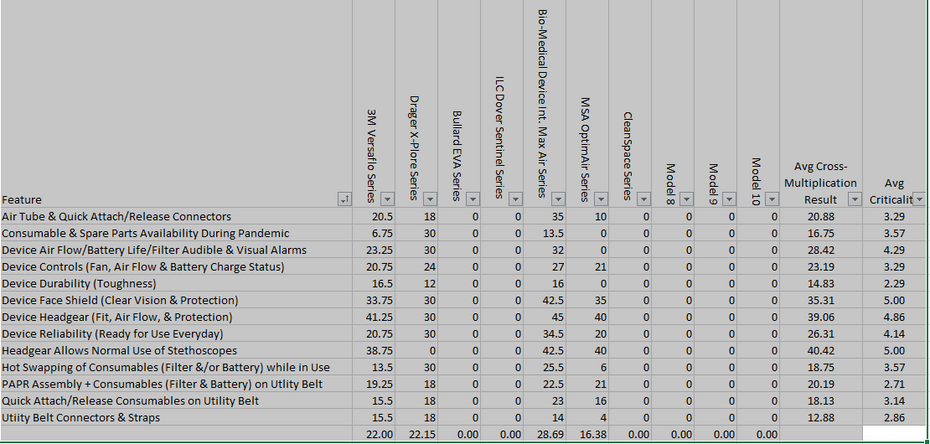
The Column "totals" in the top table are averages (because I guess they have to be?), and are the correct averages of all the values in the column. The row "totals," however, are not correct. This is the excel version of the same table:
I am at a loss to understand why the numbers are incorrect.
Solved! Go to Solution.
- Mark as New
- Bookmark
- Subscribe
- Mute
- Subscribe to RSS Feed
- Permalink
- Report Inappropriate Content
I think I have it figured out. PBI is averaging the actual values, not the averages of the values for the products. I think that's actually a better way to do it.
- Mark as New
- Bookmark
- Subscribe
- Mute
- Subscribe to RSS Feed
- Permalink
- Report Inappropriate Content
@ripstaur Go into Power Query Editor. Create a New Blank Query. Click on Advanced Editor. Ctrl-A to select all the code. Copy in all the code that I provided replacing everything that is currently in the blank query. Save the query.
Follow on LinkedIn
@ me in replies or I'll lose your thread!!!
Instead of a Kudo, please vote for this idea
Become an expert!: Enterprise DNA
External Tools: MSHGQM
YouTube Channel!: Microsoft Hates Greg
Latest book!: Power BI Cookbook Third Edition (Color)
DAX is easy, CALCULATE makes DAX hard...
- Mark as New
- Bookmark
- Subscribe
- Mute
- Subscribe to RSS Feed
- Permalink
- Report Inappropriate Content
I think I have it figured out. PBI is averaging the actual values, not the averages of the values for the products. I think that's actually a better way to do it.
- Mark as New
- Bookmark
- Subscribe
- Mute
- Subscribe to RSS Feed
- Permalink
- Report Inappropriate Content
@ripstaur This looks like a measure totals problem. Very common. See my post about it here: https://community.powerbi.com/t5/DAX-Commands-and-Tips/Dealing-with-Measure-Totals/td-p/63376
Also, this Quick Measure, Measure Totals, The Final Word should get you what you need:
https://community.powerbi.com/t5/Quick-Measures-Gallery/Measure-Totals-The-Final-Word/m-p/547907
Follow on LinkedIn
@ me in replies or I'll lose your thread!!!
Instead of a Kudo, please vote for this idea
Become an expert!: Enterprise DNA
External Tools: MSHGQM
YouTube Channel!: Microsoft Hates Greg
Latest book!: Power BI Cookbook Third Edition (Color)
DAX is easy, CALCULATE makes DAX hard...
- Mark as New
- Bookmark
- Subscribe
- Mute
- Subscribe to RSS Feed
- Permalink
- Report Inappropriate Content
So, I will admit that I am a newbie, and although I have been through the free online training on filter context twice now, I am still lost with all the filter and -X functions.
So, my understanding is that when I built a matrix, and used the Features as rows and the Products as columns, I was pretty much grouping the results into a cross-tab with those two categories, so I get the sum or average of all the values in the table for each Feature by Product. I don't have (or at least, have not consciously or deliberately created) any measures at all. I just have fields that I have selected for the matrix columns, rows and values, and I have plugged "Cross Multiplied" in for Values.
So, I don't know where I would begin to add the HASONEFILTER function to anything, or why it would be useful. The only filters on my table are the default (All) filters that PBI puts in when you select the fields...
I have tried a number of iterations in Excel to see if I can replicate the numbers PBI is giving me for row totals (actually row averages), but I haven't been able to find an algorithm that gives me the PBI results.
- Mark as New
- Bookmark
- Subscribe
- Mute
- Subscribe to RSS Feed
- Permalink
- Report Inappropriate Content
I tried to put a table in with some example data...of course, we can't have that.
- Mark as New
- Bookmark
- Subscribe
- Mute
- Subscribe to RSS Feed
- Permalink
- Report Inappropriate Content
@ripstaur I may have misunderstood the question. What is not correct? The last row of the matrix or the last two columns?
Follow on LinkedIn
@ me in replies or I'll lose your thread!!!
Instead of a Kudo, please vote for this idea
Become an expert!: Enterprise DNA
External Tools: MSHGQM
YouTube Channel!: Microsoft Hates Greg
Latest book!: Power BI Cookbook Third Edition (Color)
DAX is easy, CALCULATE makes DAX hard...
- Mark as New
- Bookmark
- Subscribe
- Mute
- Subscribe to RSS Feed
- Permalink
- Report Inappropriate Content
It is the totals in the last column - the matrix puts them there, and I want them, but I need them to be correct. Since all the numbers in the rows and columns are averages, PBI forces me to use averages in the (actually sub-) totals in the right-most column and bottom row. The numbers in the totals row at the bottom are correct (each is an average of the numbers in the column). THe numbers in the right-hand column are not the averages across the rows - I don't know how they are calculated. They are somewhat close, but not correct.
- Mark as New
- Bookmark
- Subscribe
- Mute
- Subscribe to RSS Feed
- Permalink
- Report Inappropriate Content
@ripstaur Can you share the PBIX or sample source data to recreate? Not sure where that number is coming from otherwise.
Follow on LinkedIn
@ me in replies or I'll lose your thread!!!
Instead of a Kudo, please vote for this idea
Become an expert!: Enterprise DNA
External Tools: MSHGQM
YouTube Channel!: Microsoft Hates Greg
Latest book!: Power BI Cookbook Third Edition (Color)
DAX is easy, CALCULATE makes DAX hard...
- Mark as New
- Bookmark
- Subscribe
- Mute
- Subscribe to RSS Feed
- Permalink
- Report Inappropriate Content
I'd be happy to...I actually spent an hour or so putting an example file together, but I don't see an attachment link here.
- Mark as New
- Bookmark
- Subscribe
- Mute
- Subscribe to RSS Feed
- Permalink
- Report Inappropriate Content
@ripstaur - Try this:
let
    Source = Table.FromRows(Json.Document(Binary.Decompress(Binary.FromText("pdRda8IwFAbgv3LolUKt6UnbVe/GgkzYhkwZgor4EV0gGknSsf77pXYfyjoY7blILs553uQmmc081p/PJ/xwmmeEUL4V2lv4Mw9elMwOHMQRtlq8cWAgDNwzNr1qj7kWKwlP2WHNdTExddUplvNYOcuE5hurdA5qB1/H/fQJdjHtIsEQgKR9pDB6BFfnC23Y8Lm8GXxXUJNVO/x0FxX2KKyMEcaujnYpjm6XkutlgQhi6naMaSDVvjKR/E50DdgJyUPowJ065dDCdmDfbX1PG/qooY8b+qShv2no04a+V8/XQViNkn70BxpMx7ejIePrbP+g9gMX8e+EmPgYJjB51cpaycdWnQKTm/IhX1VIoUhumfYljkgP1rnlVQKw+ArOwL0fP01iHyn6NI1KAjvNubdYfAA=", BinaryEncoding.Base64), Compression.Deflate)), let _t = ((type nullable text) meta [Serialized.Text = true]) in type table [Column = _t]),
    #"Changed Type" = Table.TransformColumnTypes(Source,{{"Column", type text}}),
    #"Removed Bottom Rows" = Table.RemoveLastN(#"Changed Type",2),
    #"Removed Top Rows" = Table.Skip(#"Removed Bottom Rows",8),
    #"Split Column by Position" = Table.SplitColumn(#"Removed Top Rows", "Column", Splitter.SplitTextByPositions({0, 32}, false), {"D:\Temp>dir.1", "D:\Temp>dir.2"}),
    #"Changed Type1" = Table.TransformColumnTypes(#"Split Column by Position",{{"D:\Temp>dir.1", type datetime}, {"D:\Temp>dir.2", type text}}),
    #"Trimmed Text" = Table.TransformColumns(#"Changed Type1",{{"D:\Temp>dir.2", Text.Trim, type text}}),
    #"Split Column by Delimiter" = Table.SplitColumn(#"Trimmed Text", "D:\Temp>dir.2", Splitter.SplitTextByEachDelimiter({" "}, QuoteStyle.Csv, false), {"D:\Temp>dir.2.1", "D:\Temp>dir.2.2"}),
    #"Changed Type2" = Table.TransformColumnTypes(#"Split Column by Delimiter",{{"D:\Temp>dir.2.1", Int64.Type}, {"D:\Temp>dir.2.2", type text}}),
    #"Renamed Columns" = Table.RenameColumns(#"Changed Type2",{{"D:\Temp>dir.1", "Date"}, {"D:\Temp>dir.2.1", "Size"}, {"D:\Temp>dir.2.2", "Filename"}})
in
    #"Renamed Columns"
Follow on LinkedIn
@ me in replies or I'll lose your thread!!!
Instead of a Kudo, please vote for this idea
Become an expert!: Enterprise DNA
External Tools: MSHGQM
YouTube Channel!: Microsoft Hates Greg
Latest book!: Power BI Cookbook Third Edition (Color)
DAX is easy, CALCULATE makes DAX hard...
- Mark as New
- Bookmark
- Subscribe
- Mute
- Subscribe to RSS Feed
- Permalink
- Report Inappropriate Content
I'm not sure what all that is, but I guess it's M code?
Is there some link somewhere where we can post files? If so, I will put up the example file and a pbix that I built from it.
- Mark as New
- Bookmark
- Subscribe
- Mute
- Subscribe to RSS Feed
- Permalink
- Report Inappropriate Content
This is the result:
What should I do next?
Helpful resources

Join us at the Microsoft Fabric Community Conference
March 31 - April 2, 2025, in Las Vegas, Nevada. Use code MSCUST for a $150 discount!

Microsoft Fabric Community Conference 2025
Arun Ulag shares exciting details about the Microsoft Fabric Conference 2025, which will be held in Las Vegas, NV.

| User | Count |
|---|---|
| 125 | |
| 85 | |
| 69 | |
| 54 | |
| 44 |
| User | Count |
|---|---|
| 204 | |
| 105 | |
| 99 | |
| 64 | |
| 54 |


