Fabric Data Days starts November 4th!
Advance your Data & AI career with 50 days of live learning, dataviz contests, hands-on challenges, study groups & certifications and more!
Get registered- Power BI forums
- Get Help with Power BI
- Desktop
- Service
- Report Server
- Power Query
- Mobile Apps
- Developer
- DAX Commands and Tips
- Custom Visuals Development Discussion
- Health and Life Sciences
- Power BI Spanish forums
- Translated Spanish Desktop
- Training and Consulting
- Instructor Led Training
- Dashboard in a Day for Women, by Women
- Galleries
- Data Stories Gallery
- Themes Gallery
- Contests Gallery
- QuickViz Gallery
- Quick Measures Gallery
- Visual Calculations Gallery
- Notebook Gallery
- Translytical Task Flow Gallery
- TMDL Gallery
- R Script Showcase
- Webinars and Video Gallery
- Ideas
- Custom Visuals Ideas (read-only)
- Issues
- Issues
- Events
- Upcoming Events
Get Fabric Certified for FREE during Fabric Data Days. Don't miss your chance! Request now
- Power BI forums
- Forums
- Get Help with Power BI
- Desktop
- Matrix - Average from Previous level
- Subscribe to RSS Feed
- Mark Topic as New
- Mark Topic as Read
- Float this Topic for Current User
- Bookmark
- Subscribe
- Printer Friendly Page
- Mark as New
- Bookmark
- Subscribe
- Mute
- Subscribe to RSS Feed
- Permalink
- Report Inappropriate Content
Matrix - Average from Previous level
Hi,
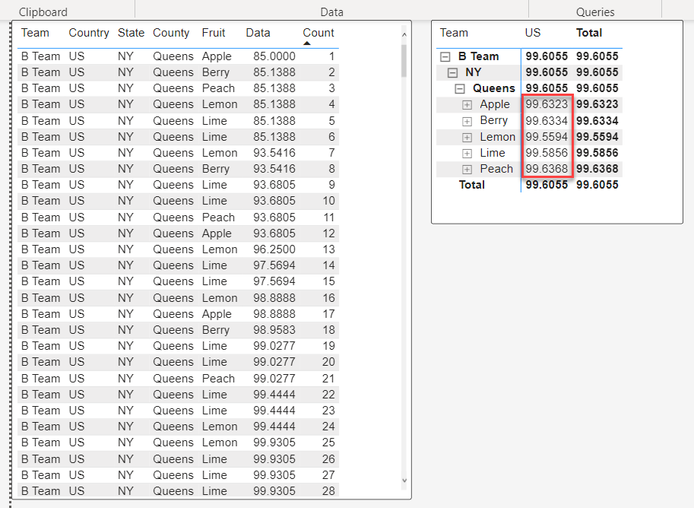
I have a table with 366 rows.
I'm trying to calculate the average in a matrix, but I want the average to be calculated from the level below.
For example, currently the average for “Queens” is calculated using all the 336.
I want to calculate the average for Queens using the 5 fruits’ averages shown below.
The average would be found using ( 99.6323, 99.6334, 99.5594, 99.5856, 99.6368) = 99.6095
Does anyone know how to calculate the average using the numbers from the previous level in a matrix?
Solved! Go to Solution.
- Mark as New
- Bookmark
- Subscribe
- Mute
- Subscribe to RSS Feed
- Permalink
- Report Inappropriate Content
I think I got it to work. I calculated the average at each level. Here is an example of the average at the highest level.
_a1 =
- Mark as New
- Bookmark
- Subscribe
- Mute
- Subscribe to RSS Feed
- Permalink
- Report Inappropriate Content
Hi @Anonymous
Please try
Average over Fruits =

AVERAGEX(
   VALUES(Table[Fruits]),
   CALCULATE(AVERAGE(Table[Fruits]))
)
Best regards
Michael
-----------------------------------------------------
If this post helps, then please consider Accept it as the solution to help the other members find it more quickly. Appreciate your thumbs up!
@ me in replies or I'll lose your thread.
-----------------------------------------------------
Visit my blog datenhungrig which I recently started with content about business intelligence and Power BI in German and English or follow me on LinkedIn!
- Mark as New
- Bookmark
- Subscribe
- Mute
- Subscribe to RSS Feed
- Permalink
- Report Inappropriate Content
Hi @Anonymous
Did you try my formula? I made a small mistake and adjusted it and it should work. Can you please try and show what happens?
Average over Fruits =

AVERAGEX(
   VALUES(Table[Fruits]),
   CALCULATE(AVERAGE(Table[Data]))
)
Best regards
Michael
-----------------------------------------------------
If this post helps, then please consider Accept it as the solution to help the other members find it more quickly. Appreciate your thumbs up!
@ me in replies or I'll lose your thread.
-----------------------------------------------------
Visit my blog datenhungrig which I recently started with content about business intelligence and Power BI in German and English or follow me on LinkedIn!
- Mark as New
- Bookmark
- Subscribe
- Mute
- Subscribe to RSS Feed
- Permalink
- Report Inappropriate Content
Hi, @Anonymous
Please try measure formula like:
Average for Queens =
VAR tab =
    SUMMARIZE (
        'Table',
        'Table'[Team],
        'Table'[Country],
        'Table'[State],
        'Table'[County],
        'Table'[Fruit],
        "Avg", AVERAGE ( 'Table'[Data] )
    )
RETURN
    AVERAGEX ( tab, [Avg] )
Result =
IF (
ISINSCOPE ( 'Table'[County] ) && NOT ISINSCOPE ( 'Table'[Fruit] ),
[Average for Queens],
AVERAGE ( 'Table'[Data] )
)Best Regards,
Community Support Team _ Eason
- Mark as New
- Bookmark
- Subscribe
- Mute
- Subscribe to RSS Feed
- Permalink
- Report Inappropriate Content
Hi Eason,
Thanks for the ISINSCOPE suggestion and PBIx file. It was helpful.
Your solution does work however my example was too simple. I need to apply the prior level idea to all levels. I tried to create an average table for each level but don't know how to create a nesting formula to use the prior levels' averages. For example, to find the Team average using the Country Average derived from the State Average derived from the County Average.
Any thoughts? I have the latest file of my work but don't see an option to attach the file.
- Mark as New
- Bookmark
- Subscribe
- Mute
- Subscribe to RSS Feed
- Permalink
- Report Inappropriate Content
I think I got it to work. I calculated the average at each level. Here is an example of the average at the highest level.
_a1 =
Helpful resources

Power BI Monthly Update - November 2025
Check out the November 2025 Power BI update to learn about new features.

Fabric Data Days
Advance your Data & AI career with 50 days of live learning, contests, hands-on challenges, study groups & certifications and more!

| User | Count |
|---|---|
| 97 | |
| 73 | |
| 50 | |
| 46 | |
| 44 |

