Join us in Barcelona for FabCon and SQLCon, September 28 - October 1, 2026.
This is best Fabric, Power BI, SQL and AI community event. How do we know? The last event sold out! Save €200 with code FABCMTY200.
Register now- Power BI forums
- Get Help with Power BI
- Desktop
- Service
- Report Server
- Power Query
- Mobile Apps
- Developer
- DAX Commands and Tips
- Custom Visuals Development Discussion
- Health and Life Sciences
- Power BI Spanish forums
- Translated Spanish Desktop
- Training and Consulting
- Instructor Led Training
- Dashboard in a Day for Women, by Women
- Galleries
- Data Stories Gallery
- Themes Gallery
- Contests Gallery
- QuickViz Gallery
- Quick Measures Gallery
- Visual Calculations Gallery
- Fabric Apps Gallery
- Notebook Gallery
- Translytical Task Flow Gallery
- TMDL Gallery
- R Script Showcase
- Webinars and Video Gallery
- Ideas
- Custom Visuals Ideas (read-only)
- Issues
- Issues
- Events
- Upcoming Events
The Fabric community is upgrading! Read all of the details including the timeline and what you can expect. Learn more
- Power BI forums
- Forums
- Get Help with Power BI
- Custom Visuals Development Discussion
- Making Deneb dynamic
- Subscribe to RSS Feed
- Mark Topic as New
- Mark Topic as Read
- Float this Topic for Current User
- Bookmark
- Subscribe
- Printer Friendly Page

- Mark as New
- Bookmark
- Subscribe
- Mute
- Subscribe to RSS Feed
- Permalink
- Report Inappropriate Content
Making Deneb dynamic
Hello everyone,
I found a really nice Deneb visual online. However, this visual is using a static number. I want to connect it with my measure, named _Percentage. I thought I needed to replace "85" with my measure (at row 13), but it wasn't so simple. How can the measure by added, so that it responds dynamically? The Deneb code is as follows:
{
"$schema": "https://vega.github.io/schema/vega/v5.json",
"width": 400,
"height": 400,
"padding": 50,
"background": "#222431",
"signals": [
{
"name": "textGradient",
"update": "{gradient: 'linear', stops: [{offset: 0, color: '#14d8cc'}, {offset: 1, color: '#4c8bee'}]}"
},
{"name": "percent", "update": "85"}],
"data": [
{
"name": "back",
"values": [],
"transform": [
{"type": "sequence", "start": 0, "stop": 100, "step": 1, "as": "val"},
{"type": "formula", "expr": "1", "as": "t"},
{
"type": "pie",
"field": "t",
"startAngle": {"signal": "0"},
"endAngle": {"signal": "2*PI"}
}
]
},
{
"name": "front",
"values": [],
"transform": [
{
"type": "sequence",
"start": 0,
"stop": {"signal": "percent"},
"step": 1,
"as": "val"
},
{"type": "formula", "expr": "1", "as": "t"},
{
"type": "pie",
"field": "t",
"startAngle": {"signal": "0"},
"endAngle": {"signal": "((2*PI)/100)*percent"}
}
]
}
],
"scales": [
{
"name": "color",
"type": "linear",
"domain": {"data": "back", "field": "val"},
"range": ["#14d8cc", "#4c8bee", "#6567ee", "#b533d2","#b533d2"]
}
],
"marks": [
{
"type": "arc",
"from": {"data": "back"},
"encode": {
"enter": {
"fill": {"value": "#3f424e"},
"x": {"signal": "width / 2"},
"y": {"signal": "height / 2"}
},
"update": {
"startAngle": {"field": "startAngle"},
"endAngle": {"field": "endAngle"},
"padAngle": {"signal": "0.015"},
"innerRadius": {"signal": "(width / 2)-15"},
"outerRadius": {"signal": "width / 2"}
}
}
},
{
"type": "arc",
"from": {"data": "front"},
"encode": {
"enter": {
"fill": {"scale": "color", "field": "val"},
"x": {"signal": "width / 2"},
"y": {"signal": "height / 2"}
},
"update": {
"startAngle": {"field": "startAngle"},
"endAngle": {"field": "endAngle"},
"padAngle": {"signal": "0.015"},
"innerRadius": {"signal": "(width / 2)-15"},
"outerRadius": {"signal": "width / 2"}
}
}
},
{
"type": "arc",
"data": [{"a": 1}],
"encode": {
"enter": {
"fill": {"value": "#3f424e"},
"x": {"signal": "width / 2"},
"y": {"signal": "height / 2"}
},
"update": {
"startAngle": {"signal": "0"},
"endAngle": {"signal": "2*PI"},
"innerRadius": {"signal": "(width / 2)-25"},
"outerRadius": {"signal": "(width / 2)-20"}
}
}
},
{
"type": "text",
"data": [{}],
"encode": {
"update": {
"text": {"signal": "percent + '%'"},
"align": {"value": "center"},
"fontWeight": {"value": "bold"},
"fill": {"signal": "textGradient"},
"x": {"signal": "width /2"},
"y": {"signal": "width /2"},
"dy": {"value":10},
"fontSize": {"value": 70}
}
}
}
,
{
"type": "text",
"data": [{}],
"encode": {
"update": {
"text": {"value": "on target"},
"align": {"value": "center"},
"fontWeight": {"value": "bold"},
"fill": {
"value": "#9092a1" },
"x": {"signal": "width /2"},
"y": {"signal": "width /2"},
"dy": {"value":40},
"fontSize": {"value": 30}
}
}
}
]
}
Solved! Go to Solution.


- Mark as New
- Bookmark
- Subscribe
- Mute
- Subscribe to RSS Feed
- Permalink
- Report Inappropriate Content
I added the data to the model and set it as a percentage type. The same with the measure.
The key thing is that percentages will be added to a Deneb visual as a decimal value, so to make this work with the template, you will need to:
- Modify my suggestion to multiply by 100 to get a number between 1 and 100 rather than 0 and 1, e.g.:
{
"name": "percent",
"update": "data('dataset')[0]['_Percentage'] * 100"
} - Because this might result in a floating point value with many decimal places, modify the text mark's text property to use a format function call to fix it to 2 decimal places, e.g.:
{
"type": "text",
"data": [{}],
"encode": {
"update": {
"text": {
"signal": "format(percent, '.2f') + '%'"
},
...
}
Note that these are minimal changes against the original template. If you have a format string against your model, you could probably use the technique in step 1 to get the _Percentage__format field that Deneb creates for measures into an additional signal and substitute that into step 2 rather than do the formating work manually, or use the pbiFormat function in Deneb to use a Power BI format string. However the above approach will work as you intend it to:
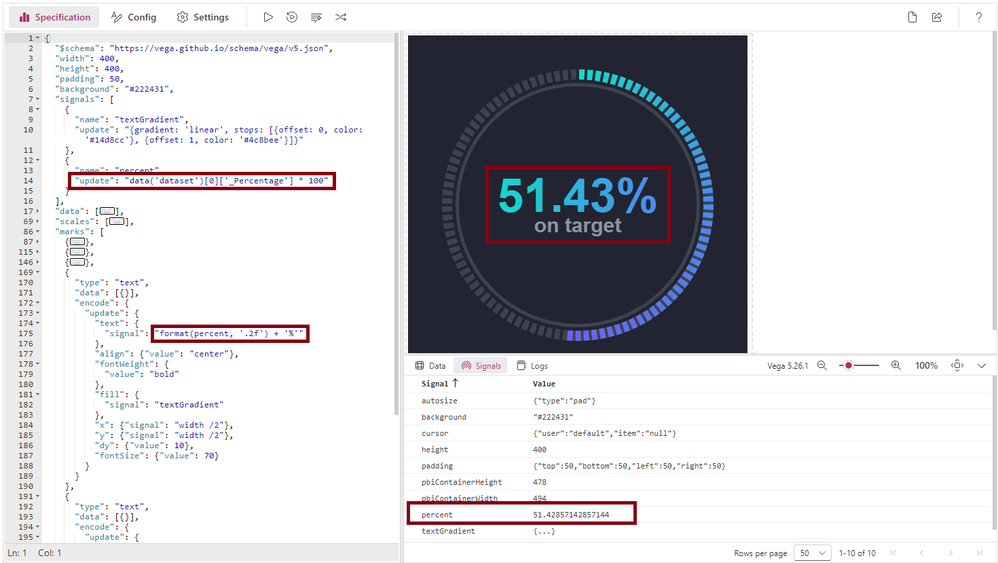
I've added this to a report and attached it so you can confirm it works and investigate the solution yourself. Changes are on lines 14 and 175 of the specification.
Regards,
Daniel
Did I answer your question? Mark my post as a solution!
Proud to be a Super User!
On how to ask a technical question, if you really want an answer (courtesy of SQLBI)
- Mark as New
- Bookmark
- Subscribe
- Mute
- Subscribe to RSS Feed
- Permalink
- Report Inappropriate Content
thanks for your replies! I tried to implement the steps, in several ways. I didn't get it to work unfortunately.
The sample data is simple, because I created some dummy data.
I have a table with a column called Percentage. It has the following data (see below).
The measure, which I added to the Deneb visual is
| 0,01 |
| 0,1 |
| 0,25 |
| 0,5 |
| 0,75 |
| 0,99 |
1 |
- Mark as New
- Bookmark
- Subscribe
- Mute
- Subscribe to RSS Feed
- Permalink
- Report Inappropriate Content
I added the data to the model and set it as a percentage type. The same with the measure.
The key thing is that percentages will be added to a Deneb visual as a decimal value, so to make this work with the template, you will need to:
- Modify my suggestion to multiply by 100 to get a number between 1 and 100 rather than 0 and 1, e.g.:
{
"name": "percent",
"update": "data('dataset')[0]['_Percentage'] * 100"
} - Because this might result in a floating point value with many decimal places, modify the text mark's text property to use a format function call to fix it to 2 decimal places, e.g.:
{
"type": "text",
"data": [{}],
"encode": {
"update": {
"text": {
"signal": "format(percent, '.2f') + '%'"
},
...
}
Note that these are minimal changes against the original template. If you have a format string against your model, you could probably use the technique in step 1 to get the _Percentage__format field that Deneb creates for measures into an additional signal and substitute that into step 2 rather than do the formating work manually, or use the pbiFormat function in Deneb to use a Power BI format string. However the above approach will work as you intend it to:
I've added this to a report and attached it so you can confirm it works and investigate the solution yourself. Changes are on lines 14 and 175 of the specification.
Regards,
Daniel
Did I answer your question? Mark my post as a solution!
Proud to be a Super User!
On how to ask a technical question, if you really want an answer (courtesy of SQLBI)
- Mark as New
- Bookmark
- Subscribe
- Mute
- Subscribe to RSS Feed
- Permalink
- Report Inappropriate Content
- Mark as New
- Bookmark
- Subscribe
- Mute
- Subscribe to RSS Feed
- Permalink
- Report Inappropriate Content
Hi @Anonymous,
Replace line 13 with the following:
{
  "name": "percent",
  "update": "data('dataset')[0]['_Percentage']"
}
This requests the value of the _Percentage measure in the first row of the dataset that Deneb creates.
Ref: Vega data() function
Ref: how Deneb assigns the internal dataset
Regards,
Daniel
Did I answer your question? Mark my post as a solution!
Proud to be a Super User!
On how to ask a technical question, if you really want an answer (courtesy of SQLBI)

- Mark as New
- Bookmark
- Subscribe
- Mute
- Subscribe to RSS Feed
- Permalink
- Report Inappropriate Content
to get your data from Power BI you need to use
"data": {"name": "dataset"}
Please provide sample data.
Helpful resources

FabCon & SQLCon – Barcelona 2026
Join us in Barcelona for FabCon and SQLCon, the Fabric, Power BI, SQL, and AI community event. Save €200 with code FABCMTY200.

Power BI DataViz World Championships - June 2026
A new Power BI DataViz World Championship is coming this June! Don't miss out on submitting your entry.


