Join us at the 2025 Microsoft Fabric Community Conference
March 31 - April 2, 2025, in Las Vegas, Nevada. Use code MSCUST for a $150 discount! Early Bird pricing ends December 9th.
Register Now- Power BI forums
- Get Help with Power BI
- Desktop
- Service
- Report Server
- Power Query
- Mobile Apps
- Developer
- DAX Commands and Tips
- Custom Visuals Development Discussion
- Health and Life Sciences
- Power BI Spanish forums
- Translated Spanish Desktop
- Training and Consulting
- Instructor Led Training
- Dashboard in a Day for Women, by Women
- Galleries
- Community Connections & How-To Videos
- COVID-19 Data Stories Gallery
- Themes Gallery
- Data Stories Gallery
- R Script Showcase
- Webinars and Video Gallery
- Quick Measures Gallery
- 2021 MSBizAppsSummit Gallery
- 2020 MSBizAppsSummit Gallery
- 2019 MSBizAppsSummit Gallery
- Events
- Ideas
- Custom Visuals Ideas
- Issues
- Issues
- Events
- Upcoming Events
- Community Blog
- Power BI Community Blog
- Power BI 中文博客
- Community Support
- Community Accounts & Registration
- Using the Community
- Community Feedback
Get certified in Microsoft Fabric—for free! For a limited time, the Microsoft Fabric Community team will be offering free DP-600 exam vouchers. Prepare now
- Power BI forums
- Forums
- Get Help with Power BI
- Desktop
- Re: Logic for custom buckets
- Subscribe to RSS Feed
- Mark Topic as New
- Mark Topic as Read
- Float this Topic for Current User
- Bookmark
- Subscribe
- Printer Friendly Page
- Mark as New
- Bookmark
- Subscribe
- Mute
- Subscribe to RSS Feed
- Permalink
- Report Inappropriate Content
Logic for custom buckets
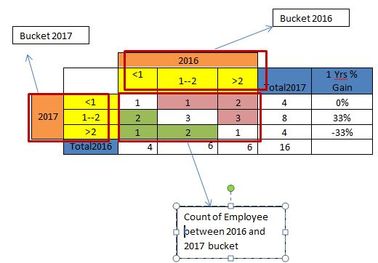
Hi Team, I am new to power bi, Can you help me to create these bucket as shown in screen shot. We have Emp ID available in our tables but how to show count of EMP between 2016/2017 buckets?
And what is the best visualization we can use to show these types of graphs. ?
Is I have to use IF condition to create these bucket ..? as ::
IF(Data[Amount]<=1000 && YEAR(Data[Date])=(MAX('Date'[Year])-1) || Data[Amount]<=1000 && YEAR(Data[Date])=MAX('Date'[Year]),"<1",
IF(Data[Amount]<=1000 && YEAR(Data[Date])=(MAX('Date'[Year])-1) || Data[Amount]>=1000 && Data[Amount]<2001 && YEAR(Data[Date])=MAX('Date'[Year]),"<1",............................
- Mark as New
- Bookmark
- Subscribe
- Mute
- Subscribe to RSS Feed
- Permalink
- Report Inappropriate Content
Hi @Himanshu,
For the screenshot, you need to use Matrix visual to visualize data, Bucket 2017 in Row group, Bucket 2016 in column group and the count values as matrix values. You can go through this tutorial to learn matrix visual.
For your requirement, it would be better you can share some sample data of source table, so we can try to test how to model data.
Best Regards,
Qiuyun Yu
If this post helps, then please consider Accept it as the solution to help the other members find it more quickly.
- Mark as New
- Bookmark
- Subscribe
- Mute
- Subscribe to RSS Feed
- Permalink
- Report Inappropriate Content
Hi @v-qiuyu-msftQiuyun,
Thanks for reply.. I have attached an excel file.. We have to craete 2 bucket (for 2016/2017) and show the count of Emp between them.
https://www.dropbox.com/s/o6b429w5pagjmkj/Data_Sample.xlsx?dl=0
- Mark as New
- Bookmark
- Subscribe
- Mute
- Subscribe to RSS Feed
- Permalink
- Report Inappropriate Content
Hi @Himanshu,
Can you clarify the logic to return the "<1","1-2" and ">2", and "count of Employee between 2016 and 2017 bucket" regarding your sample data?
Best Regards,
Qiuyun Yu
If this post helps, then please consider Accept it as the solution to help the other members find it more quickly.
- Mark as New
- Bookmark
- Subscribe
- Mute
- Subscribe to RSS Feed
- Permalink
- Report Inappropriate Content
Hi @v-qiuyu-msft,
<1 : Salary less than 1000
1-2 : between 1000-2000
>2 : greater than 2000
I have to create 2 bucket
Bucket 2016 | Bucket 2017
<1 | <1
1-2 | 1-2
>2 | >2
Logic is :: If in 2016 bucket Emp salary is "<1" and in 2017 bucket Emp salary is ">2" then the count of Emp comes between highlighted box :
- Mark as New
- Bookmark
- Subscribe
- Mute
- Subscribe to RSS Feed
- Permalink
- Report Inappropriate Content
Logic is :: If in 2016 bucket Emp salary is "<1" and in 2017 bucket Emp salary is ">2" then the count of Emp comes between highlighted box :
Hi @Himanshu,
You can go to Query Editor, filter table for 2016 and 2017 year separately then merge them based on Emp. Then create calculated columns in report to return <1,1-2,>2, use matrix to visualize data. For more information, please see attached pbix file.
Best Regards,
Qiuyun Yu
If this post helps, then please consider Accept it as the solution to help the other members find it more quickly.
Helpful resources

Join us at the Microsoft Fabric Community Conference
March 31 - April 2, 2025, in Las Vegas, Nevada. Use code MSCUST for a $150 discount! Early Bird pricing ends December 9th.

Power BI Monthly Update - November 2024
Check out the November 2024 Power BI update to learn about new features.

| User | Count |
|---|---|
| 121 | |
| 98 | |
| 89 | |
| 72 | |
| 62 |
| User | Count |
|---|---|
| 140 | |
| 121 | |
| 106 | |
| 98 | |
| 94 |


