FabCon is coming to Atlanta
Join us at FabCon Atlanta from March 16 - 20, 2026, for the ultimate Fabric, Power BI, AI and SQL community-led event. Save $200 with code FABCOMM.
Register now!- Power BI forums
- Get Help with Power BI
- Desktop
- Service
- Report Server
- Power Query
- Mobile Apps
- Developer
- DAX Commands and Tips
- Custom Visuals Development Discussion
- Health and Life Sciences
- Power BI Spanish forums
- Translated Spanish Desktop
- Training and Consulting
- Instructor Led Training
- Dashboard in a Day for Women, by Women
- Galleries
- Data Stories Gallery
- Themes Gallery
- Contests Gallery
- QuickViz Gallery
- Quick Measures Gallery
- Visual Calculations Gallery
- Notebook Gallery
- Translytical Task Flow Gallery
- TMDL Gallery
- R Script Showcase
- Webinars and Video Gallery
- Ideas
- Custom Visuals Ideas (read-only)
- Issues
- Issues
- Events
- Upcoming Events
The Power BI Data Visualization World Championships is back! It's time to submit your entry. Live now!
- Power BI forums
- Forums
- Get Help with Power BI
- Desktop
- Linking table values
- Subscribe to RSS Feed
- Mark Topic as New
- Mark Topic as Read
- Float this Topic for Current User
- Bookmark
- Subscribe
- Printer Friendly Page
- Mark as New
- Bookmark
- Subscribe
- Mute
- Subscribe to RSS Feed
- Permalink
- Report Inappropriate Content
Linking table values
Hi,
I would like to report the performance of employees against a number of criteria. The data source is Excel table called Performance, example below:
| Season | Criteria X | Criteria Y | Criteria Z | |
| Employee A | Summer | Below | Outstanding | Exceed |
| Employee B | Summer | Average | Average | Below |
| Employee C | Summer | Good | Average | Average |
| Employee D | Summer | Average | Outstanding | Below |
I would like to be able to show:
- Visuals showing percentage of all employees at each rating (Below, Average etc) for each criteria. I hope to slice by 'Criteria'.
- For each employee, a visual of their performance across all the criteria
The assessment is not numeric however I know that to generate visuals that have the categories in order bad>good I will need to assign each rating a corresponding numeric index value.
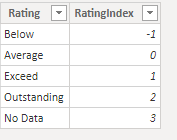
I have added a table called Rating which I would like to link to, to assign the value to each rating. (I've chosen -1 to 3 but I suppose that could be just 1-5?)
But I cannot work out how to link the value in RatingIndex to each entry in the performance table. I have looked at the RELATED function and LOOKUPVALUE but both need the tables to be related (I think) and there is no relationship between my tables.
It feels like I should be able to do this in PBI without adding new columns into the source excel sheet to add a number next to each text rating.
When I report my Performance table I want the tool to 'see' and use the RatingIndex value rather than the text 'Below, Average etc'.
I hope that makes sense!!
Solved! Go to Solution.
- Mark as New
- Bookmark
- Subscribe
- Mute
- Subscribe to RSS Feed
- Permalink
- Report Inappropriate Content
Try this solution.
1. In Power Query, unpivot the Criteria columns by selecting the three Criteria columns, then right-click and select Unpivot Columns. Rename the Attribute column as Criteria.
2. Create relationship:
3. Create calculated column in Performance table:
Rating Index = RELATED ( Rating[RatingIndex] )
4. Result:
Did I answer your question? Mark my post as a solution!
Proud to be a Super User!
- Mark as New
- Bookmark
- Subscribe
- Mute
- Subscribe to RSS Feed
- Permalink
- Report Inappropriate Content
Thanks @DataInsights - a huge help, I hadn't thought of unpivoting but it has worked perfectly.
- Mark as New
- Bookmark
- Subscribe
- Mute
- Subscribe to RSS Feed
- Permalink
- Report Inappropriate Content
Try this solution.
1. In Power Query, unpivot the Criteria columns by selecting the three Criteria columns, then right-click and select Unpivot Columns. Rename the Attribute column as Criteria.
2. Create relationship:
3. Create calculated column in Performance table:
Rating Index = RELATED ( Rating[RatingIndex] )
4. Result:
Did I answer your question? Mark my post as a solution!
Proud to be a Super User!
Helpful resources

Power BI Dataviz World Championships
The Power BI Data Visualization World Championships is back! It's time to submit your entry.

Power BI Monthly Update - January 2026
Check out the January 2026 Power BI update to learn about new features.

| User | Count |
|---|---|
| 68 | |
| 54 | |
| 37 | |
| 27 | |
| 22 |
| User | Count |
|---|---|
| 135 | |
| 119 | |
| 55 | |
| 37 | |
| 31 |


