FabCon is coming to Atlanta
Join us at FabCon Atlanta from March 16 - 20, 2026, for the ultimate Fabric, Power BI, AI and SQL community-led event. Save $200 with code FABCOMM.
Register now!- Power BI forums
- Get Help with Power BI
- Desktop
- Service
- Report Server
- Power Query
- Mobile Apps
- Developer
- DAX Commands and Tips
- Custom Visuals Development Discussion
- Health and Life Sciences
- Power BI Spanish forums
- Translated Spanish Desktop
- Training and Consulting
- Instructor Led Training
- Dashboard in a Day for Women, by Women
- Galleries
- Data Stories Gallery
- Themes Gallery
- Contests Gallery
- QuickViz Gallery
- Quick Measures Gallery
- Visual Calculations Gallery
- Notebook Gallery
- Translytical Task Flow Gallery
- TMDL Gallery
- R Script Showcase
- Webinars and Video Gallery
- Ideas
- Custom Visuals Ideas (read-only)
- Issues
- Issues
- Events
- Upcoming Events
The Power BI Data Visualization World Championships is back! Get ahead of the game and start preparing now! Learn more
- Power BI forums
- Forums
- Get Help with Power BI
- Desktop
- Lingaro Gantt Chart several milestones per project
- Subscribe to RSS Feed
- Mark Topic as New
- Mark Topic as Read
- Float this Topic for Current User
- Bookmark
- Subscribe
- Printer Friendly Page
- Mark as New
- Bookmark
- Subscribe
- Mute
- Subscribe to RSS Feed
- Permalink
- Report Inappropriate Content
Lingaro Gantt Chart several milestones per project
Does anyone know of a way to show multiple milestones for one project? Currently, it simply mirrors the data structure, which is:
Project Milestone Date
x Sign contract 01-01-2021
x Start production 01-02-2021
y Project approval 01-04-2021
y Deliverable 1 01-05-2021
Tableau does this neatly where it automatically groups the projects and lists the deliverables for each project. Can Power BI something similar?
I have tried Lingaro that shows it like this:
I have also the Gantt 2.2.3 by Power BI (I believe it is) but it gets the milestones all wrong.
Greatly appreciate any help with this
Cheers,
Rebecca
- Mark as New
- Bookmark
- Subscribe
- Mute
- Subscribe to RSS Feed
- Permalink
- Report Inappropriate Content
Hi Rebecca,
Been wrestling with this one myself and came across this article which works for Gantt 2.2.3 The trick to the getting the milestones to line up is to make sure you have both a start and end date in your row for the milestone, and no other dates (such as task start date) otherwise the visual picks up the first date it can find.
Second thing to note is that your data will need repeating rows with the task name the same for each milestone, and then select the Group option (not Parent) as outlined in this post -that will line them up on the same row.
Solved: Gantt Chart 2.2.0 milestones - Microsoft Power BI Community
- Mark as New
- Bookmark
- Subscribe
- Mute
- Subscribe to RSS Feed
- Permalink
- Report Inappropriate Content
Hi @VahidDM
Thanks for your reply
However, it doesn't really solve what I'm looking for. And it gets the milestone dates wrong.
I've uploaded the work files and Power BI file here: https://www.dropbox.com/sh/8t4rkmanaza0lso/AACy-6HfTMKafATXs9NfVtDHa?dl=0
What I'm looking for is something like the Lingaro view, but with the milestones grouped together per project and shown on the same bar. So there is only one bar per project.
Does it make sense? Can you help?
Cheers
Rebecca
- Mark as New
- Bookmark
- Subscribe
- Mute
- Subscribe to RSS Feed
- Permalink
- Report Inappropriate Content
Hi @Anonymous
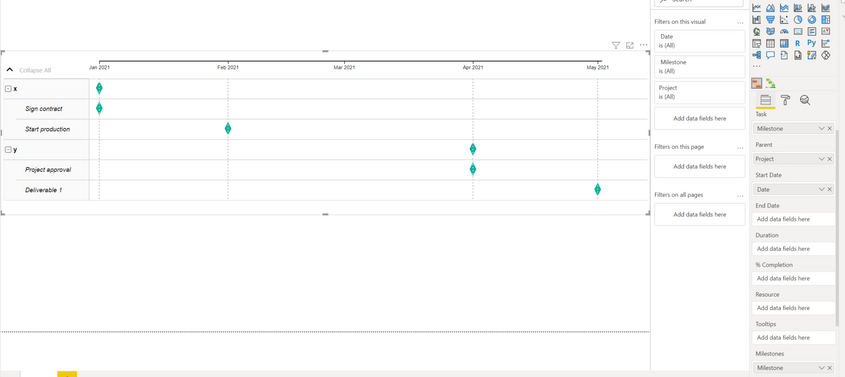
In Gantt 2.2.3, Add Milestone column to the Task and Milestone, and Date Column to the Start Date.
If you want to group them by project, Add Project Column to the Parent.
Like this:
Did I answer your question? Mark my post as a solution!
Appreciate your Kudos !!
Helpful resources

Power BI Dataviz World Championships
The Power BI Data Visualization World Championships is back! Get ahead of the game and start preparing now!

| User | Count |
|---|---|
| 41 | |
| 38 | |
| 36 | |
| 30 | |
| 28 |
| User | Count |
|---|---|
| 129 | |
| 88 | |
| 79 | |
| 68 | |
| 63 |


