FabCon is coming to Atlanta
Join us at FabCon Atlanta from March 16 - 20, 2026, for the ultimate Fabric, Power BI, AI and SQL community-led event. Save $200 with code FABCOMM.
Register now!- Power BI forums
- Get Help with Power BI
- Desktop
- Service
- Report Server
- Power Query
- Mobile Apps
- Developer
- DAX Commands and Tips
- Custom Visuals Development Discussion
- Health and Life Sciences
- Power BI Spanish forums
- Translated Spanish Desktop
- Training and Consulting
- Instructor Led Training
- Dashboard in a Day for Women, by Women
- Galleries
- Data Stories Gallery
- Themes Gallery
- Contests Gallery
- QuickViz Gallery
- Quick Measures Gallery
- Visual Calculations Gallery
- Notebook Gallery
- Translytical Task Flow Gallery
- TMDL Gallery
- R Script Showcase
- Webinars and Video Gallery
- Ideas
- Custom Visuals Ideas (read-only)
- Issues
- Issues
- Events
- Upcoming Events
View all the Fabric Data Days sessions on demand. View schedule
- Power BI forums
- Forums
- Get Help with Power BI
- Desktop
- Re: Line Charts with Cumulative values
- Subscribe to RSS Feed
- Mark Topic as New
- Mark Topic as Read
- Float this Topic for Current User
- Bookmark
- Subscribe
- Printer Friendly Page
- Mark as New
- Bookmark
- Subscribe
- Mute
- Subscribe to RSS Feed
- Permalink
- Report Inappropriate Content
Line Charts with Cumulative values
I have my data like this (image below)
Now i need to create a line chart in Power BI. I am getting something like this (sample image below)
Just for illustration i used this chart (Target and Actuals are two lines).
Now i need the lines to be cumulative over months. How can i do that in Power BI?
Solved! Go to Solution.
- Mark as New
- Bookmark
- Subscribe
- Mute
- Subscribe to RSS Feed
- Permalink
- Report Inappropriate Content
Hi @GaRaGe,
First, you should create a calculated column to get a number format month. If we use the Jan, Feb, Mar and so on. Month will order by alphabet.
Month! = SWITCH(Test[Month],"Jan",1,"Feb",2,"Mar",3,"Apr",4,"May",5,"Jun",6,"Jul",7,"Aug",8,"Sep",9,"Oct",10,"Nov",11,12)
Then create two measure for cumulative spend over month.
Target = CALCULATE(SUM(Test[Spend]),FILTER(ALL(Test),Test[Month!]<=MAX(Test[Month!])&&Test[Metric]="Target"))

Actual = CALCULATE(SUM(Test[Spend]),FILTER(ALL(Test),Test[Month!]<=MAX(Test[Month!])&&Test[Metric]="Actual"))
Finally, create a line chart, select the [month!] field as axis, the two measures as value level.
Please feel free to ask if you any issue.
Best Regards,
Angelia
- Mark as New
- Bookmark
- Subscribe
- Mute
- Subscribe to RSS Feed
- Permalink
- Report Inappropriate Content
Hi all,
I've having issues with this measure. The line chart is cumulative for some months but not for others. Here's what I've got.
Actual Cumulative = CALCULATE(SUM(InvoiceDetails[Total LAD Funding]),FILTER(ALL('Date'),'Date'[Date]<=MAX(InvoiceDetails[Month invoiced])))
Budget Cumulative = CALCULATE(SUM(Spendperlot[Total]),FILTER(ALL('Date'),'Date'[Date]<=MAX(InvoiceDetails[Month invoiced])))
The figures are contained in separate tables and should include all of the values in those tables.
Chart looks like this.
I've set up a date table following this guide https://docs.microsoft.com/en-us/power-bi/guidance/model-date-tables and looks like this for example:
Data in the Month Invoiced table looks like this
Has any one got ideas to why this isn't working properly?
- Mark as New
- Bookmark
- Subscribe
- Mute
- Subscribe to RSS Feed
- Permalink
- Report Inappropriate Content
Hi,
You should have a relationship (Many to One and Single) between the Month invoiced column and the Date column of the Date Table. Ensure that the Month name column is sorted by the Month number column in the Date table. To the X-axis of your visual, drag Year and Month name from the Date table. Write these measures:
Actual Cumulative = CALCULATE(SUM(InvoiceDetails[Total LAD Funding]),datesbetween('Date'[Date],minx(all('Date'[Date]),'Date'[Date]),max('Date'[Date])))Hope this helps.
Regards,
Ashish Mathur
http://www.ashishmathur.com
https://www.linkedin.com/in/excelenthusiasts/
- Mark as New
- Bookmark
- Subscribe
- Mute
- Subscribe to RSS Feed
- Permalink
- Report Inappropriate Content
Hi there,
No luck im afriad. Chart looks like this
Here's the link to my file https://drive.google.com/file/d/1-litA5nfaKu4OPcpEVEGnKJG3E4sfA8E/view?usp=sharing
Any help is appreciated.
- Mark as New
- Bookmark
- Subscribe
- Mute
- Subscribe to RSS Feed
- Permalink
- Report Inappropriate Content
Hi,
Make the first relationship active.
Regards,
Ashish Mathur
http://www.ashishmathur.com
https://www.linkedin.com/in/excelenthusiasts/
- Mark as New
- Bookmark
- Subscribe
- Mute
- Subscribe to RSS Feed
- Permalink
- Report Inappropriate Content
Super. Thanks.
However the chart looks like this
The chart goes go up and seems to be ignoring every other month using continuous.
Or looks like this if categorical shows every day individually.
I'm looking for it to show every month on the x axis so the chart goes up gradually rather than in chunks.
- Mark as New
- Bookmark
- Subscribe
- Mute
- Subscribe to RSS Feed
- Permalink
- Report Inappropriate Content
Hi,
You may download my PBI file from here.
Hope this helps.
Regards,
Ashish Mathur
http://www.ashishmathur.com
https://www.linkedin.com/in/excelenthusiasts/
- Mark as New
- Bookmark
- Subscribe
- Mute
- Subscribe to RSS Feed
- Permalink
- Report Inappropriate Content
Thanks so much for your help.
- Mark as New
- Bookmark
- Subscribe
- Mute
- Subscribe to RSS Feed
- Permalink
- Report Inappropriate Content
You are welcome. If my previous reply helped, please mark that reply as Answer.
Regards,
Ashish Mathur
http://www.ashishmathur.com
https://www.linkedin.com/in/excelenthusiasts/
- Mark as New
- Bookmark
- Subscribe
- Mute
- Subscribe to RSS Feed
- Permalink
- Report Inappropriate Content
Hi @GaRaGe,
First, you should create a calculated column to get a number format month. If we use the Jan, Feb, Mar and so on. Month will order by alphabet.
Month! = SWITCH(Test[Month],"Jan",1,"Feb",2,"Mar",3,"Apr",4,"May",5,"Jun",6,"Jul",7,"Aug",8,"Sep",9,"Oct",10,"Nov",11,12)
Then create two measure for cumulative spend over month.
Target = CALCULATE(SUM(Test[Spend]),FILTER(ALL(Test),Test[Month!]<=MAX(Test[Month!])&&Test[Metric]="Target"))

Actual = CALCULATE(SUM(Test[Spend]),FILTER(ALL(Test),Test[Month!]<=MAX(Test[Month!])&&Test[Metric]="Actual"))
Finally, create a line chart, select the [month!] field as axis, the two measures as value level.
Please feel free to ask if you any issue.
Best Regards,
Angelia
- Mark as New
- Bookmark
- Subscribe
- Mute
- Subscribe to RSS Feed
- Permalink
- Report Inappropriate Content
Hi Angelia,
Are you able to have a look to see where I'm going wrong with my measures? https://community.powerbi.com/t5/Desktop/Line-Charts-with-Cumulative-values/m-p/2758568/highlight/tr...
- Mark as New
- Bookmark
- Subscribe
- Mute
- Subscribe to RSS Feed
- Permalink
- Report Inappropriate Content
I have a question on the solution, I'm getting a cumalitive result fine, but I want it just for this year, as opposed to going as far back as the equivalent of the test[spend] table goes
If I date a Date filter, it still sums from the beginning of the table, as opposed to all results for the current year.
- Mark as New
- Bookmark
- Subscribe
- Mute
- Subscribe to RSS Feed
- Permalink
- Report Inappropriate Content
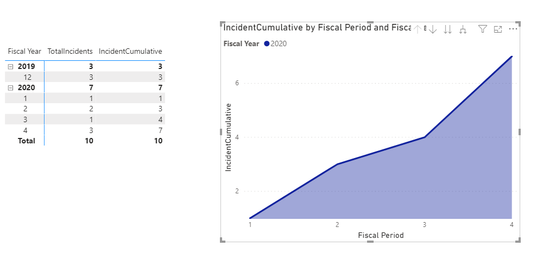
I know this is an old thread but i would like to ask a question on your solution. I have setup a measure to use COUNTA to total the number of tickets. I create a Matrix table and add Fiscal Year and Fiscal Period followed by adding the CountA measure. This is working as expected. I create a new measure see below that references the COUNTA measure to workout the cumulative totals for each Fiscal Period. I add this measure to the table and it is working as expected. Great.
- Mark as New
- Bookmark
- Subscribe
- Mute
- Subscribe to RSS Feed
- Permalink
- Report Inappropriate Content
Hi,
Share some data and show the expected result in a simple table format.
Regards,
Ashish Mathur
http://www.ashishmathur.com
https://www.linkedin.com/in/excelenthusiasts/
- Mark as New
- Bookmark
- Subscribe
- Mute
- Subscribe to RSS Feed
- Permalink
- Report Inappropriate Content
The below image shows the values cumulating correctly but with the Fiscal Period on the X-Axis. Note the table is showing the correct details.
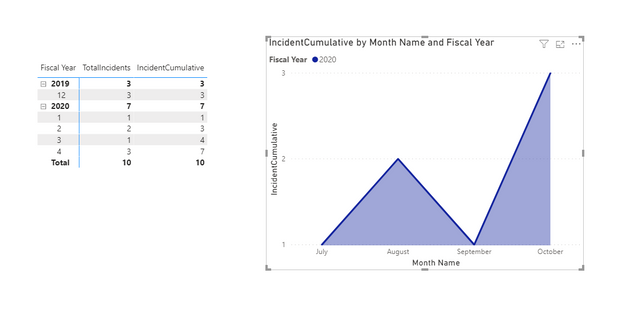
If i change the X-Axis to Month Name the Chart changes and is not cumulative.
- Mark as New
- Bookmark
- Subscribe
- Mute
- Subscribe to RSS Feed
- Permalink
- Report Inappropriate Content
Hi,
Share the link from where i can download your PBI file.
Regards,
Ashish Mathur
http://www.ashishmathur.com
https://www.linkedin.com/in/excelenthusiasts/
- Mark as New
- Bookmark
- Subscribe
- Mute
- Subscribe to RSS Feed
- Permalink
- Report Inappropriate Content
Hi, I have the same problem. If I send you the project could you help me?
- Mark as New
- Bookmark
- Subscribe
- Mute
- Subscribe to RSS Feed
- Permalink
- Report Inappropriate Content
Hi,
Share some data, describe the question and show the expected result.
Regards,
Ashish Mathur
http://www.ashishmathur.com
https://www.linkedin.com/in/excelenthusiasts/
- Mark as New
- Bookmark
- Subscribe
- Mute
- Subscribe to RSS Feed
- Permalink
- Report Inappropriate Content
First of all, thank you for your availability. Basically I have a graph that takes the costs of various locations of my company, I copy in a column only the costs of projects with ROI <2 years and then on the graph I can filter them by site (plant), by project phase (stage) and by date (the project completion dates are entered on the x axis). What I want to get is the cumulative value of the costs. Apparently the chart works well with these filters:
but when I select the filters differently, this happens:
What am I doing wrong? Thanks in advance.
Link to download the project: https://www.dropbox.com/s/txaqxv83llcjfp0/Test.pbix?dl=0
- Mark as New
- Bookmark
- Subscribe
- Mute
- Subscribe to RSS Feed
- Permalink
- Report Inappropriate Content
Hi,
You may download my PBI file from here.
Hope this helps.
Regards,
Ashish Mathur
http://www.ashishmathur.com
https://www.linkedin.com/in/excelenthusiasts/
- Mark as New
- Bookmark
- Subscribe
- Mute
- Subscribe to RSS Feed
- Permalink
- Report Inappropriate Content
Helpful resources

Power BI Monthly Update - November 2025
Check out the November 2025 Power BI update to learn about new features.

Fabric Data Days
Advance your Data & AI career with 50 days of live learning, contests, hands-on challenges, study groups & certifications and more!


