- Subscribe to RSS Feed
- Mark Topic as New
- Mark Topic as Read
- Float this Topic for Current User
- Bookmark
- Subscribe
- Printer Friendly Page
- Mark as New
- Bookmark
- Subscribe
- Mute
- Subscribe to RSS Feed
- Permalink
- Report Inappropriate Content

Like for Like or Not Like on the current Year.
Hello.
I have a fact table with days, store, and sales. I have used a manual table that identifies dislike for the similar state, to assign one five LFL states (LFL, New, Closed, Travel, Transfer) to each line of the fact table.
Visual correctly shows the sales by day / week and the store sorted by LFL status for the current year, but when you calculate the last year for comparison, the status picks up the index of the last year, not current date. Current year may be LFL but last year NEW or on example New but last year Transfer.
Tried REMOVEFILTERS on LFL dimension table, it shows last year's sales in each LFL status column as expected.
How to make it show only where the store and date have current year sales, ignoring the previous year's LFL status on the relevant line in the fact table, or an alternative?
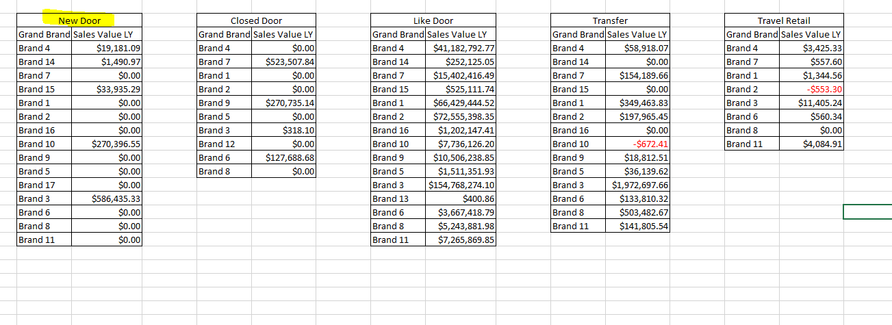
I need to get to the values of the image when I filter for example New Door, the values of last year must be the ones shown in the table called new door, so on with each filter.
Thanks.
Sales Value LY LFL =
VAR CustomersInvoices =
    ADDCOLUMNS (
        VALUES ( Fac_Sales[ID_LFL] ), -- Use Customers table if you have one
         "AmountCurrentMonth", [Sales Value],
        "AmountPreviousMonth", CALCULATE ( [Sales Value],CROSSFILTER('Calendar'[Date],'dDate'[Date],OneWay),SAMEPERIODLASTYEAR(dDate[Date]) )
    )
VAR CustomersWithGrowth =
    FILTER ( CustomersInvoices, [ID_LFL] =[ID_LFL] )
VAR Result =
  SUMX ( CustomersWithGrowth,[AmountPreviousMonth])
RETURN Result
- Mark as New
- Bookmark
- Subscribe
- Mute
- Subscribe to RSS Feed
- Permalink
- Report Inappropriate Content

Hi @vazmor ,
Sorry for that the information you have provided is not making the problem clear to me.
please provide me with more details about your expected output.
In case you want to show current as well as last year based on an only one year selection in slicer. I'd suggest you create a new table for year slicer and then create a flag measure for filter.
Best Regards,
Eyelyn Qin
If this post helps, then please consider Accept it as the solution to help the other members find it more quickly.
- Mark as New
- Bookmark
- Subscribe
- Mute
- Subscribe to RSS Feed
- Permalink
- Report Inappropriate Content

Hello, what I need, for example, in the image there is a table called New Door, I need that when in the PBIX file I filter through a slicer what New Door says, those New Door values appear from the image that is marked in yellow .
The problem is that when I filter New door and calculate last year, it filters out New doors from last year, but I still lack a store that was Transfer, so I need to take the current stores and bring me last year's from them stores no matter if they were previously Transfer, New Door, etc.
I have already tried multiple measures, even creating a viartual table using Summarize, Addcolumns, etc. and still can't get the desired result.
Thanks.
Helpful resources
| Subject | Author | Posted | |
|---|---|---|---|
| 08-16-2024 02:52 AM | |||
| 09-18-2024 07:24 AM | |||
| 09-21-2024 12:45 PM | |||
| 12-05-2023 01:43 AM | |||
| 09-19-2024 12:01 PM |
| User | Count |
|---|---|
| 128 | |
| 100 | |
| 85 | |
| 53 | |
| 46 |


