FabCon is coming to Atlanta
Join us at FabCon Atlanta from March 16 - 20, 2026, for the ultimate Fabric, Power BI, AI and SQL community-led event. Save $200 with code FABCOMM.
Register now!- Power BI forums
- Get Help with Power BI
- Desktop
- Service
- Report Server
- Power Query
- Mobile Apps
- Developer
- DAX Commands and Tips
- Custom Visuals Development Discussion
- Health and Life Sciences
- Power BI Spanish forums
- Translated Spanish Desktop
- Training and Consulting
- Instructor Led Training
- Dashboard in a Day for Women, by Women
- Galleries
- Data Stories Gallery
- Themes Gallery
- Contests Gallery
- Quick Measures Gallery
- Notebook Gallery
- Translytical Task Flow Gallery
- TMDL Gallery
- R Script Showcase
- Webinars and Video Gallery
- Ideas
- Custom Visuals Ideas (read-only)
- Issues
- Issues
- Events
- Upcoming Events
To celebrate FabCon Vienna, we are offering 50% off select exams. Ends October 3rd. Request your discount now.
- Power BI forums
- Forums
- Get Help with Power BI
- Desktop
- Latest entry for distinct values in Power BI
- Subscribe to RSS Feed
- Mark Topic as New
- Mark Topic as Read
- Float this Topic for Current User
- Bookmark
- Subscribe
- Printer Friendly Page
- Mark as New
- Bookmark
- Subscribe
- Mute
- Subscribe to RSS Feed
- Permalink
- Report Inappropriate Content
Latest entry for distinct values in Power BI
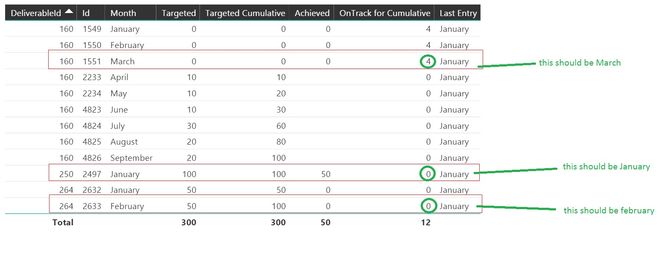
I need to get the latest entry for Ontrack for Cumulative column.
I tried get the latest entry by filtering the entries in achievement field by excluding the blank fields however this formula is only showing March as latest month.
Last Entry = CALCULATE(MAX('KPI'[Month]),FILTER('KPI','KPI'[Achieved]<>BLANK())).
As an example
For Deliverable:160, I need to see the Ontrack for Cumulative for latest entry which is in March - >OnTrack for **bleep**=4 & Latest Month should be March
For Deliverable:250, I need to see the Ontrack for Cumulative for latest entry which is in January- >OnTrack for **bleep**=0 & Latest month should be January
For Deliverable:264, I need to see the Ontrack for Cumulative for latest entry which is in February- >OnTrack for **bleep**=0 & Latest month should be February
Now with my calculation, for each deliverableID, latest entry is seen in MARCH.
Solved! Go to Solution.
- Mark as New
- Bookmark
- Subscribe
- Mute
- Subscribe to RSS Feed
- Permalink
- Report Inappropriate Content
Hi,
Is this the result you are expecting? You may download the file from here. Please note that i have removed the Status column. You had written a Status calculated column formula which in turn was refering a measure. A calculated column formula should not refer to a measure. If the result in the file is correct, then we can talk of the second problem i.e. getting the Status column in the Table with the help of a measure (not a calculated column).
Regards,
Ashish Mathur
http://www.ashishmathur.com
https://www.linkedin.com/in/excelenthusiasts/
- Mark as New
- Bookmark
- Subscribe
- Mute
- Subscribe to RSS Feed
- Permalink
- Report Inappropriate Content
Hey,
it would be helpful if you create a pbix with sample data, upload the file to onedrive or dropbox and share the link.
I assume you create a calculated column?
You receive March for all you deliverables, because your current DAX takes not the single Deliverable into account. This could be done something like this
name of the column =
CALCULATE(
    MAX('tablename'[Month])
    ,FILTER(
        ALLEXCEPT('tablename', 'tablename'[DeliverableID])
    ,'tablename'[Achieved] <> BLANK()
)
But you also have to keep in mind that MAX() from a string column returns March instead of April due to to alphabetically ordering.
I assume that you have to do the following
- Determine the MAX ID (assuming that the ID is a number that reflects a sequence and is unique across all deliverables) for each deliverable
- use the max ID to determine the value for the Last Entry column, maybe using the function LOOKUPVALUE()
https://msdn.microsoft.com/en-us/library/gg492170.aspx
If there is no sustainable Business Rule to determine the order of IDs, calculating a cumulative value will not be possible. You also might consider to transform the Month column in a real date value: 2018-02-01 represents February in the year 2018 and 2017-01-01 represents January in the year 2017
Hopefully this gives you an idea
Kind regards
Tom
Did I answer your question? Mark my post as a solution, this will help others!
Proud to be a Super User!
I accept Kudos 😉
Hamburg, Germany
- Mark as New
- Bookmark
- Subscribe
- Mute
- Subscribe to RSS Feed
- Permalink
- Report Inappropriate Content
Hi Tom,
Thanks for the response. My issue is also related to month field in original table. As you said its in string format.
I tried to get the order of months with a copy of KPI table, where I converted these months to date format. My original datasource is on Sharepoint, so I couldnt change the dates in Original Table. As a result I get a copy of this table, open in excel, and added two fields 2 show monts. 1-Date format 2-numbers from 1 to 12.
But I couldnt handle the max value with that way. When I want to put a filter on different table, I receive a circular dependency error.
What exactly I need, is to get the last Ontrack Cumulative value in this table.
So I thought, If I can get the latest entry for each distinct deliverable, I can sort out. However It wasnt successfull.
I uploaded the pbix example with example data on dropbox:
https://www.dropbox.com/s/wx3hcklr860c33s/Calculate%20Ontrack%20based%20on%20Last%20Entry.pbix?dl=0
- Mark as New
- Bookmark
- Subscribe
- Mute
- Subscribe to RSS Feed
- Permalink
- Report Inappropriate Content
Hi,
Is this the result you are expecting? You may download my PBI solution file from here.
Regards,
Ashish Mathur
http://www.ashishmathur.com
https://www.linkedin.com/in/excelenthusiasts/
- Mark as New
- Bookmark
- Subscribe
- Mute
- Subscribe to RSS Feed
- Permalink
- Report Inappropriate Content
Hi Ashish,
Thank you so much... This is what I`m looking for actually. However when I tried in original source, I couldnt sort it with that way.
You succesfully get the latest month , however I could be able to get the relevant month info for non-empty fields.
Now I`m adding the original source that I worked on; kindly check;
https://www.dropbox.com/s/o62aoapb871b76i/sample-2.pbix?dl=0
- Mark as New
- Bookmark
- Subscribe
- Mute
- Subscribe to RSS Feed
- Permalink
- Report Inappropriate Content
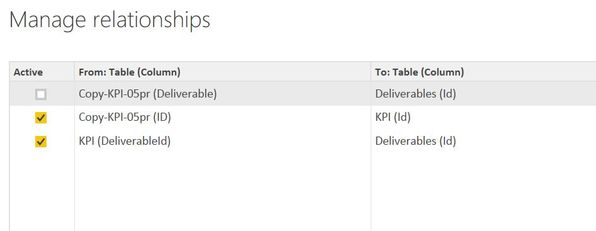
You have completed changed the question. In the original file you shared, there was a relationship from the KPIOrj table to the CopyKPI table - now there is no such relatioship. If your final relatioships are the ones that you have shown in your sample2 file, then there must be a date column in the KPI table.
Also, please share the final result you want.
Regards,
Ashish Mathur
http://www.ashishmathur.com
https://www.linkedin.com/in/excelenthusiasts/
- Mark as New
- Bookmark
- Subscribe
- Mute
- Subscribe to RSS Feed
- Permalink
- Report Inappropriate Content
Hi Ashish,
I checked the relation in the second file, I have a relation from Copy Kpi - Original KPI. I couldn`t get the point that you mentioned. Only names of tables are different in sample.
Should I have a relation from KPI - Copy Kpi? Does it make a difference if I switch them?
Actually my main problem was the month field in KPI table, which is string format.
Although today sharepoint developer added a new column in KPI Table, which is in date format, still in powerBi I can not convert this column to a date... PowerBi realize as a text... Because of this issue, I get a copy of KPI table and in excel manually I added a month column in date format. With that way, PowerBI understand as date. Strange..
As a second option, I wanted to add a column in KPI Table, however I couldnt replace January with a date.
Maximum point that I reached is to replace January with numbers like 1-2-3. Do you have a suggestion for converting to date?
As a method I tried,
Measure =SWITCH(KPI[MonthNumber],1,"January",2,"February",3,"March",4,"April",5,"May",6,"June",7,"July",8,"August",9,"September",10,"October",11,"November",12,"December")
But this is not helping me to sort the months properly in the table. I also tried to switch dates with mmddyyyy format, but it didnt work....
In the example that I sent to you, my main aim is to get the latest OnTrack Value...So what I thought, If I can get the latest entry for each ID like 160, 164 etc based on the last entered achievement, I can find out the corresponding On Track Value. And make my calculations.
Kindly find below example output;
Many thanks for the support
- Mark as New
- Bookmark
- Subscribe
- Mute
- Subscribe to RSS Feed
- Permalink
- Report Inappropriate Content
Hi,
Is this the result you are expecting? You may download the file from here. Please note that i have removed the Status column. You had written a Status calculated column formula which in turn was refering a measure. A calculated column formula should not refer to a measure. If the result in the file is correct, then we can talk of the second problem i.e. getting the Status column in the Table with the help of a measure (not a calculated column).
Regards,
Ashish Mathur
http://www.ashishmathur.com
https://www.linkedin.com/in/excelenthusiasts/
- Mark as New
- Bookmark
- Subscribe
- Mute
- Subscribe to RSS Feed
- Permalink
- Report Inappropriate Content
Hi Ashish,
This is what I was looking for thank you so much..
I also find a way to add a new column and switch it to date format. Maybe it will be usefull for end users, I used the following code:
Column = SWITCH('KPI'[Month],"January",DATE(2018,01,01),"February",DATE(2018,02,01),"March",DATE(2018,03,01),"April",DATE(2018,04,01),"May",DATE(2018,05,01),"June",DATE(2018,06,01),"July",DATE(2018,07,01),"August",DATE(2018,08,01),"September",DATE(2018,09,01),"October",DATE(2018,10,01),"November",DATE(2018,11,01),"December",DATE(2018,12,01))
Many thanks for your support
- Mark as New
- Bookmark
- Subscribe
- Mute
- Subscribe to RSS Feed
- Permalink
- Report Inappropriate Content
You are welcome.
Regards,
Ashish Mathur
http://www.ashishmathur.com
https://www.linkedin.com/in/excelenthusiasts/


