FabCon is coming to Atlanta
Join us at FabCon Atlanta from March 16 - 20, 2026, for the ultimate Fabric, Power BI, AI and SQL community-led event. Save $200 with code FABCOMM.
Register now!- Power BI forums
- Get Help with Power BI
- Desktop
- Service
- Report Server
- Power Query
- Mobile Apps
- Developer
- DAX Commands and Tips
- Custom Visuals Development Discussion
- Health and Life Sciences
- Power BI Spanish forums
- Translated Spanish Desktop
- Training and Consulting
- Instructor Led Training
- Dashboard in a Day for Women, by Women
- Galleries
- Data Stories Gallery
- Themes Gallery
- Contests Gallery
- QuickViz Gallery
- Quick Measures Gallery
- Visual Calculations Gallery
- Notebook Gallery
- Translytical Task Flow Gallery
- TMDL Gallery
- R Script Showcase
- Webinars and Video Gallery
- Ideas
- Custom Visuals Ideas (read-only)
- Issues
- Issues
- Events
- Upcoming Events
The Power BI Data Visualization World Championships is back! Get ahead of the game and start preparing now! Learn more
- Power BI forums
- Forums
- Get Help with Power BI
- Desktop
- Is it possible to setup conditional formatting bas...
- Subscribe to RSS Feed
- Mark Topic as New
- Mark Topic as Read
- Float this Topic for Current User
- Bookmark
- Subscribe
- Printer Friendly Page
- Mark as New
- Bookmark
- Subscribe
- Mute
- Subscribe to RSS Feed
- Permalink
- Report Inappropriate Content
Is it possible to setup conditional formatting based on comparing two values from different columns?
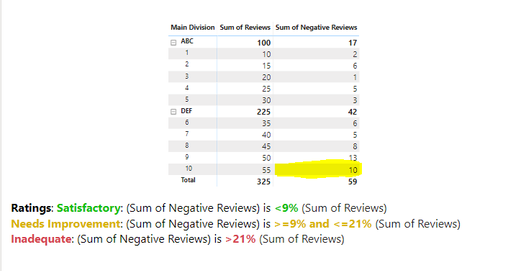
Using the below table as a reference, I'm wanting to setup up conditional formatting so that the "Sum of Negative Reviews" column is dependent on several percentage thresholds related to the "Sum of Reviews" column (see ratings scale on attached image). For example if the "Sum of Reviews" is 55 and the "Sum of Negative Reviews" is 10, the background color should turn yellow because it falls between 9% and 21% of 55, which is a range of 4.95 and 11.55. Any feedback is appreciated. Thank you.
Solved! Go to Solution.
- Mark as New
- Bookmark
- Subscribe
- Mute
- Subscribe to RSS Feed
- Permalink
- Report Inappropriate Content
@SHicks216 , Prefer measure, You can use a measure that returns color based on condition and use that in conditional formatting using the field value option
example
Measure =
Switch(true(),
max(Table[status]) = "In production" , Switch(true(),
[SLA] = 1 , "Green" ,
[SLA] >= .5 , "Amber" ,
"Red "
) ,
max(Table[status]) = " Product completed" , Switch(true(),
[SLA] = 1 , "Green" ,
[SLA] >= .5 , "Amber" ,
"Red "
)
)
Measure =
Switch(true(),
max(Table[status]) = "In production" , "Red" ,
max(Table[status]) = " Product completed" , "Green" ,
"blue "
)
How to do conditional formatting by measure and apply it on pie?
https://www.youtube.com/watch?v=RqBb5eBf_I4&list=PLPaNVDMhUXGYo50Ajmr4SgSV9HIQLxc8L
https://community.powerbi.com/t5/Community-Blog/Power-BI-Conditional-formatting-the-Pie-Visual/ba-p/...
https://amitchandak.medium.com/power-bi-where-is-the-conditional-formatting-option-in-new-format-pan...
Helpful resources

Power BI Dataviz World Championships
The Power BI Data Visualization World Championships is back! Get ahead of the game and start preparing now!

| User | Count |
|---|---|
| 61 | |
| 44 | |
| 41 | |
| 36 | |
| 21 |
| User | Count |
|---|---|
| 176 | |
| 120 | |
| 106 | |
| 77 | |
| 52 |


