cancel
Showing results for 
Search instead for 
Did you mean: 

Level up your Power BI skills this month - build one visual each week and tell better stories with data! Get started

Reply
Anonymous
Not applicable

How to make a column of week over week percent change of total hours

Hi,


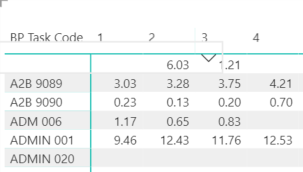
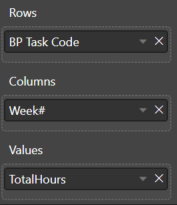
New Power BI user here. I want to create a new column to show the percent change difference from week to week. I was trying different methods but none have worked. My week# is a column I created with a numeric data type. 

sample.PNGrows and column.PNG


1 ACCEPTED SOLUTION
Anonymous
Not applicable

Thank you!


This was my final code. (I updated the formula to find the percent change)


Measure =
VAR pre_week_hours =
    CALCULATE (
        SUM ( Data[Hours] ),
        FILTER ( ALL ( Data[Week] ), Data[Week] = MAX ( Data[Week] ) - 1 )
    )
VAR current_week_hours =
    SUM ( Data[Hours] )
RETURN
    IF (
        pre_week_hours = BLANK (),
        BLANK (),
        DIVIDE (
            ABS ( current_week_hours - pre_week_hours ),
            ( pre_week_hours)
        ) * 100
    )

View solution in original post

5 REPLIES 5
v-cherch-msft
Microsoft Employee
Microsoft Employee

Hi @Anonymous 

You may refer to below measure:

Measure =
VAR pre_week_hours =
    CALCULATE (
        SUM ( Data[Hours] ),
        FILTER ( ALL ( Data[Week] ), Data[Week] = MAX ( Data[Week] ) - 1 )
    )
VAR current_week_hours =
    SUM ( Data[Hours] )
RETURN
    IF (
        pre_week_hours = BLANK (),
        BLANK (),
        DIVIDE (
            ABS ( pre_week_hours - current_week_hours ),
            ( pre_week_hours + current_week_hours ) / 2
        )
    )

Regards,

Community Support Team _ Cherie Chen
If this post helps, then please consider Accept it as the solution to help the other members find it more quickly.
Anonymous
Not applicable

Thank you!


This was my final code. (I updated the formula to find the percent change)


Measure =
VAR pre_week_hours =
    CALCULATE (
        SUM ( Data[Hours] ),
        FILTER ( ALL ( Data[Week] ), Data[Week] = MAX ( Data[Week] ) - 1 )
    )
VAR current_week_hours =
    SUM ( Data[Hours] )
RETURN
    IF (
        pre_week_hours = BLANK (),
        BLANK (),
        DIVIDE (
            ABS ( current_week_hours - pre_week_hours ),
            ( pre_week_hours)
        ) * 100
    )
Anonymous
Not applicable

Please be clearer. Have you created a date table? Your function is SAMEPERIODLASTWEEK or similar time intelligence functions
Anonymous
Not applicable

I have created a date table that joins to the main table with the data


I was able to do a past year analysis with percent changes with the following formulas:


TotalHoursPY = CALCULATE ( [TotalHours], SAMEPERIODLASTYEAR('v_clndr_day'[ClndrDt]) )

TotalHoursPYDiff = [TotalHours] - [TotalHoursPY]

TotalHoursPYDiff% = 100 * ABS([TotalHoursPY] - [TotalHours]) / (([TotalHoursPY] + [TotalHours])/2)


Since its a week number and its not a date time function how can I achieve this?

Sameperiodlastweek did not not work since it wasn't a valid fuction.

Anonymous
Not applicable

That's true, I was wrong. As far as I remember Dax does not have "week" intelligence functions. Look here https://www.sqlbi.com/articles/week-based-time-intelligence-in-dax/

Helpful resources

Announcements
April Power BI Update Carousel

Power BI Monthly Update - April 2026

Check out the April 2026 Power BI update to learn about new features.

Fabric SQL PBI Data Days

Data Days 2026 coming soon!

Sign up to receive a private message when registration opens and key events begin.

New to Fabric survey Carousel

New to Fabric Survey

If you have recently started exploring Fabric, we'd love to hear how it's going. Your feedback can help with product improvements.

Power BI DataViz World Championships carousel

Power BI DataViz World Championships - June 2026

A new Power BI DataViz World Championship is coming this June! Don't miss out on submitting your entry.